Figure 1.
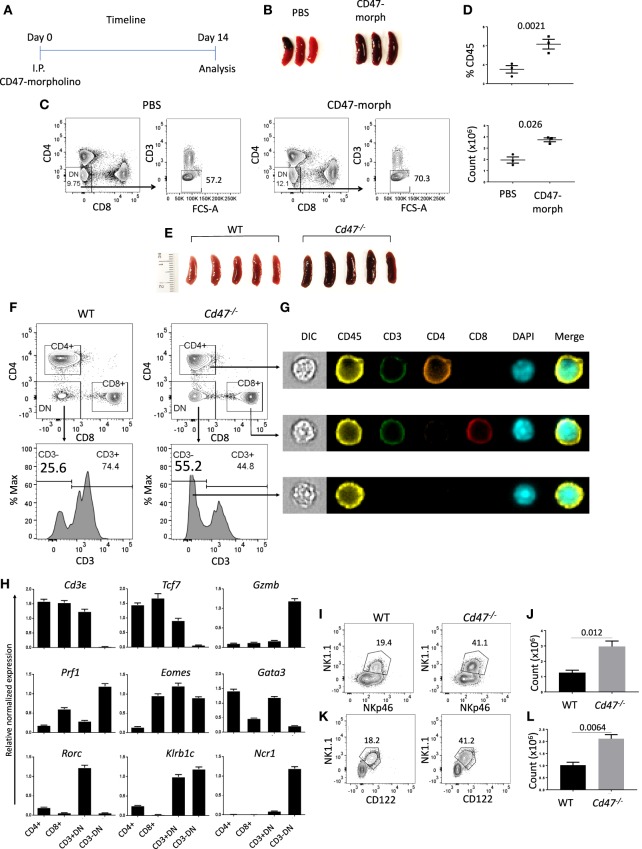
CD47 deficiency increases immature NK-lineage cells in spleen. (A) Time line showing C57BL/6 mice received i.p. injections of 750 μl PBS or CD47-morpholino (10 μmol/L in PBS) and were analyzed 2 weeks later. (B) Morphology of spleens at day 14 of treated and control mice. (C,D) Splenocytes were stained for lineage (Lin: B220, CD19, CD11b, CD11c, CD49b, CD105, MHC-II, and Ter119), CD3, CD4, and CD8 and acquired in a flow cytometer. DAPI was used to discriminate live/dead cells. Representative contour plots (values indicate percentage of parent population), frequency and counts of live Lin−CD3−CD4−CD8− cells in PBS vs. CD47-morpholino treated mice are shown, n = 3. (E) Morphology of spleens was depicted from WT and Cd47−/− littermate mice. (F–G) Splenocytes were enriched for lineage-negative cells and stained for CD3, CD4, and CD8. FACS plots and ImageStream analysis show staining for live Lin−-CD4+, -CD8+, -CD3+CD4−CD8− (-CD3+DN) and -CD3−CD4−CD8− (-CD3−DN) cells in WT and Cd47−/− spleens. (H) RT-qPCR analysis of Lin−-CD4+, -CD8+, -CD3+DN and -CD3−DN populations sorted from spleens of Cd47−/− mice was performed, β-Actin and Gapdh used as reference genes and relative normalized expressions are shown, n = 3. Representative contour plots (values indicate percentage of parent population) and counts of live FcR-blocked (I,J) CD45.2+CD3−CD4−CD8−NK1.1+NKp46+ cells and (K,L) CD45.2+Lin (CD11b, CD11c, CD19, B220, CD49b, CD105, MHC-II, and Ter119)−CD3−CD4−CD8−NK1.1+CD122+ cells in the spleens of WT and Cd47−/− littermate mice are shown. Data are representative of two experiments involving 3–4 mice per experiment (Mean ± SEM).

