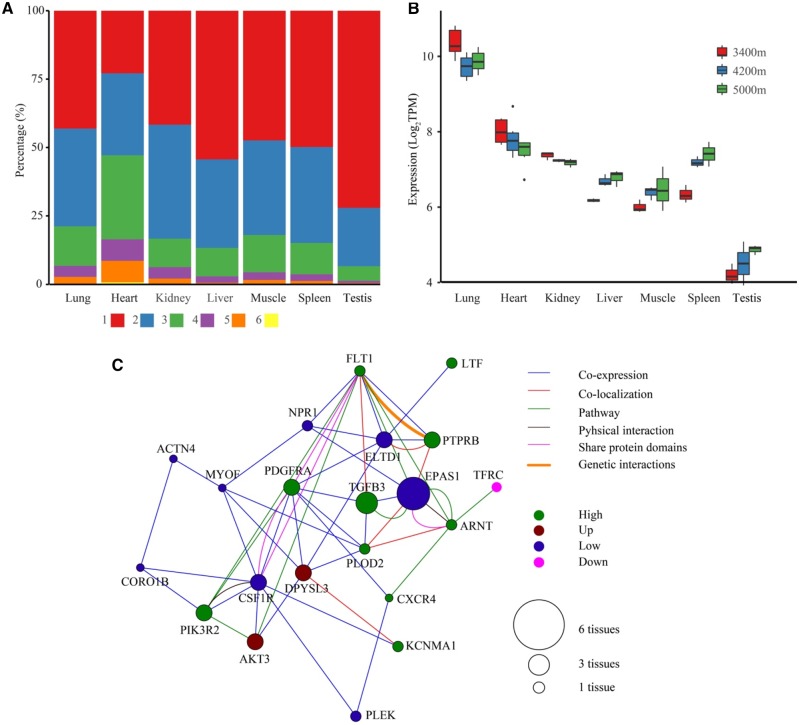
Fig. 2.
—Transcriptional changes in response to high altitude. (A) Distribution of DEEs across tissues. A majority of DEEs is restricted to one tissue type (the red portion). (B) Expression level of EPAS1 at different altitudes among different tissues. Only lung show a nonlinear change with the lowest expression at 4,200 m, whereas all other tissues show a linear change (increase or decrease linearly with altitude). (C) Network of differentially expressed hypoxic genes in lung. The colored solid circles indicate different expression patterns with altitude.

