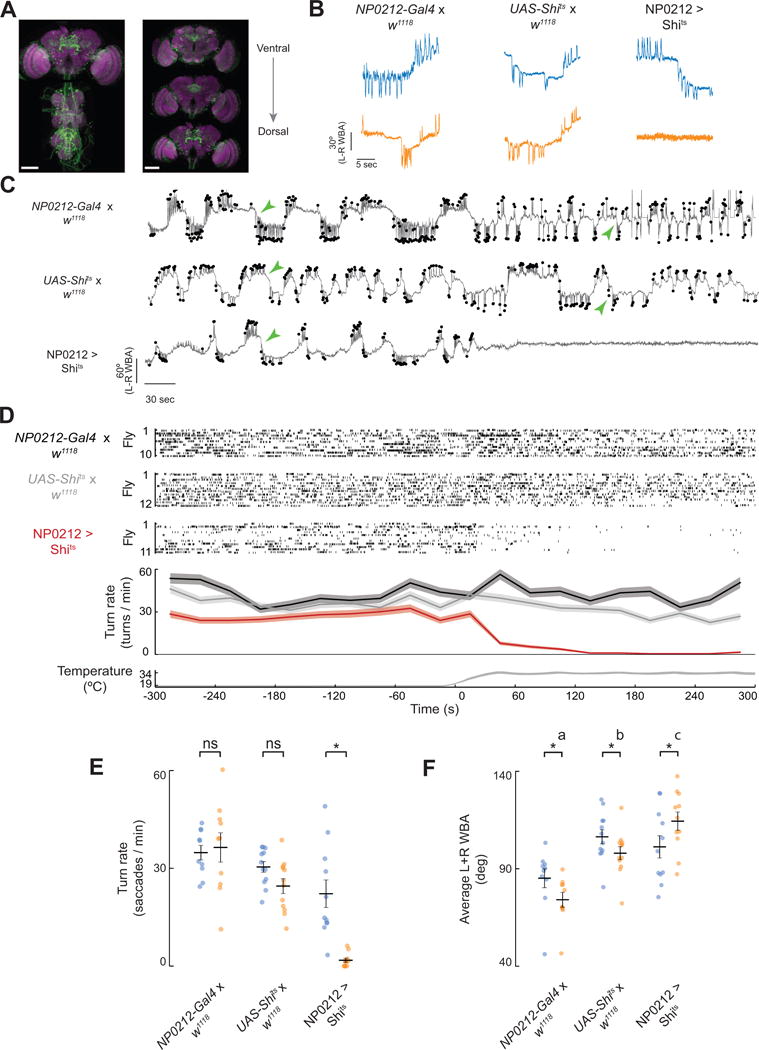
Figure 2. Inhibiting synaptic transmission in NP0212 eliminates spontaneous saccades, but not expansion-evoked flight turns.

(A) Immunofluorescence of mCD8-GFP (green) and Brp (magenta) in the brain and thoracic ganglion of a NP0212 > GFP fly. Left: Max z-projection. Right: max z-projections of three subsets in z. Scale bars: 100 μm. (B) Example traces of spontaneous turning behavior in NP0212 > Shits and parental control flies at 19°C (blue) and 34°C (orange). (C) Ten-minute-long example traces. Saccades are indicated black dots. Traces are aligned to the x axis in D. Green arrowheads indicate examples of persistent turns. (D) Top three sections: raster plot of turns in NP0212 > Shits and parental controls. Every line represents an individual fly, and each saccade is indicated by a tick. Second from bottom: the average turning rate of each genotype, binned every 30s. Filled regions indicate 95% confidence intervals. Bottom: temperature traces from 5 flies from each genotype overlaid. Time zero was set to when the bath hit 26°C. (E) Spontaneous turning rate of NP0212 > Shits flies and parental controls at 19°C (blue) and 34°C (orange) (black bars: mean ± SEM, * p < 0.05, Wilcoxon Signed Rank Test with a Bonferroni Correction, n = 10–12). (F) Average L+R WBA of NP0212 > Shits flies and parental controls at 19°C (blue) and 34°C (orange), (n = 10–12, black bars: mean ± SEM, * p < 0.05, Wilcoxon Signed Rank Test with a Bonferroni Correction. Genotypes labeled with different letters have average L+R WBA values at 34°C that are significantly different, p < 0.05, Mann-Whitney U Test with Bonferroni correction). See also Figures S2, S3.
