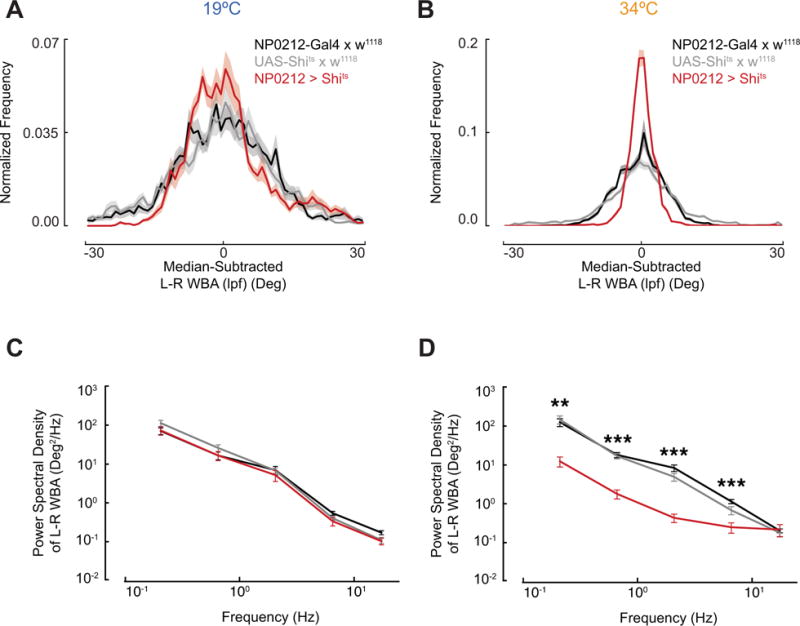
Figure 3. Slow turns are eliminated by inhibiting synaptic transmission in NP0212.

(A) Distribution of L–R WBA(lpf) during flight at 19°C for NP0212 > Shits (n = 11 flies, red) and parental controls (NP0212-GAL4 × w1118, n = 10, black, and UAS-Shits × w1118, n = 12, gray), mean ± 95% C.I. (B) Same as A, but at 34°C. NP0212 > Shits flies’ L–R WBA(lpf) distributions display lower variance than both parental controls at both temperatures, p <<< 0.001, Levene’s test of variance. (C) Average power spectra of the L–R WBA of NP0212 > Shits flies (n = 11) and parental controls (NP0212-GAL4 × w1118, n = 10, and UAS-Shits × w1118, n = 12, colors as above) at the 19°C, binned between half-powers of ten. Spectra are plotted on a log10-log10 scale. Mean ± SEM. (D) Same as C, but at 34°C. Significance asterisks indicate that NP0212 > Shits is significantly different from both parental controls, *** p < 0.001, ** p < 0.01, Mann-Whitney U Test. See also figure S3.
