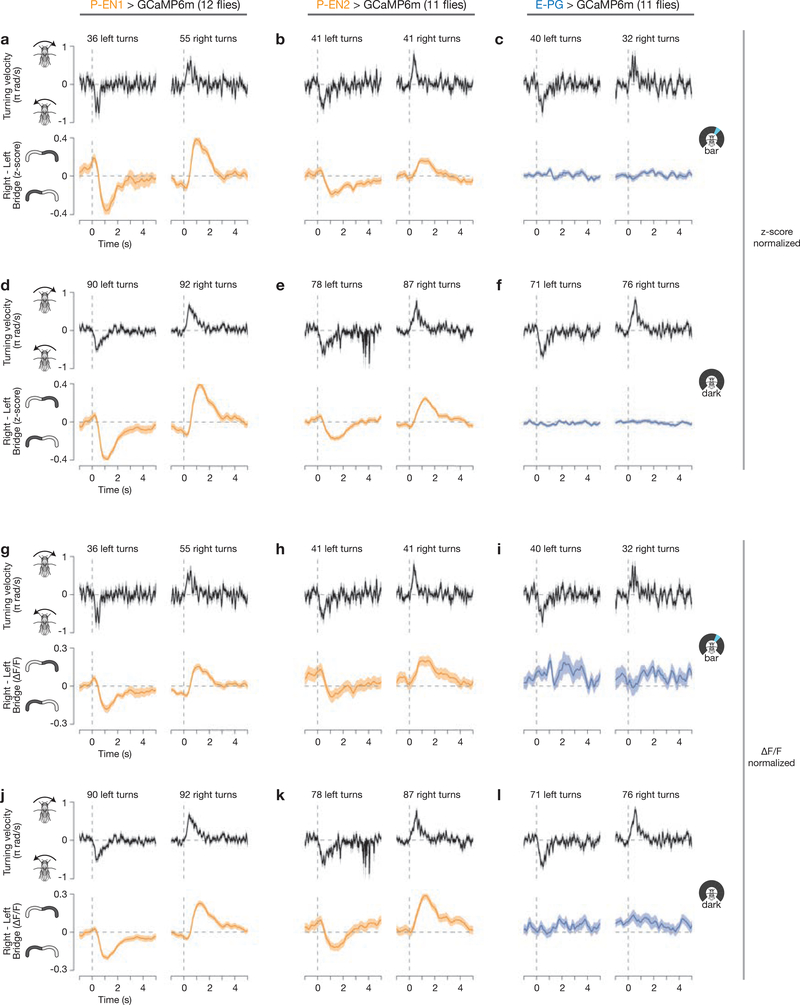
Extended Data Figure 5 |. P-EN1 and P-EN2 bridge asymmetry during turns in closed-loop bar and dark conditions, computed with z-score and ΔF/F normalization.
A–c, Right–left bridge activity (bottom) and the fly’s turning velocity (top), averaged over multiple turns, for P-EN1s (a), P-EN2s (b) and E-PGs (c), as in Fig. 2h–j, in closed-loop bar conditions. The right–left GCaMP signal is computed from z-score normalized data. d–f, Same as a–c but in constant darkness. g–l, Same as a–f, except that the right-left GCaMP signal is computed from ΔF/F normalized data. The mean and s.e.m. across turns are shown. Only data for which the bar was visible on the front 270° of the LED arena were included for closed-loop bar plots. See Methods for details.

