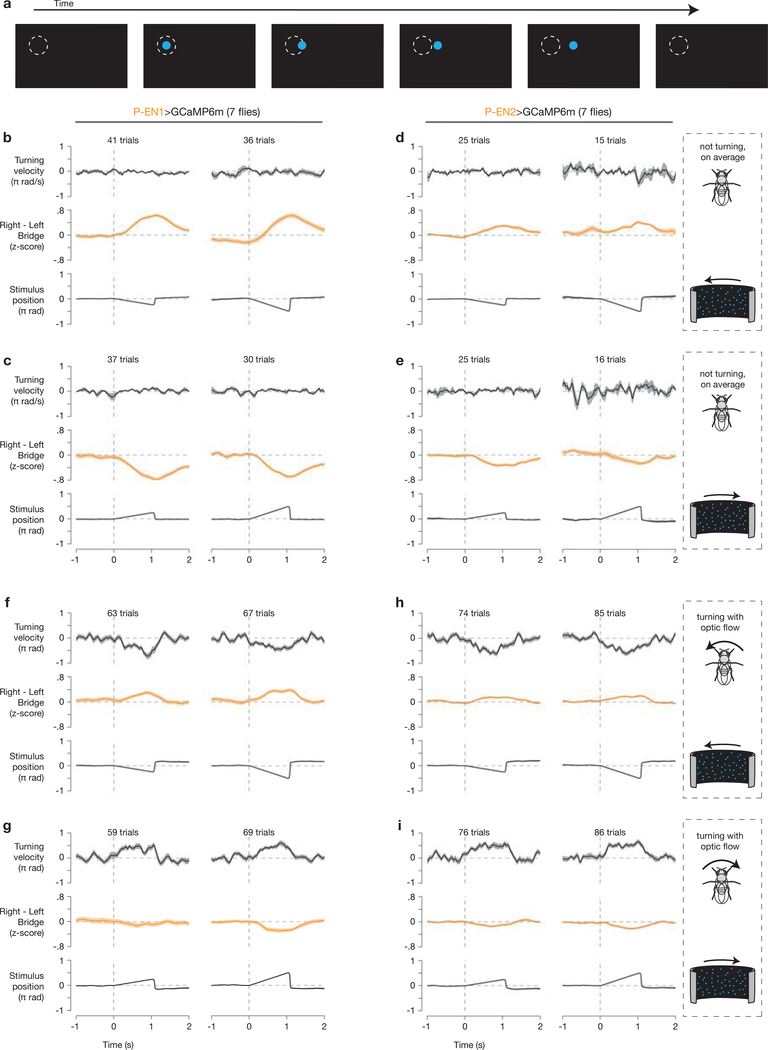
Extended Data Figure 6 |. P-EN1 and P-EN2 asymmetries are driven in part by optic flow.
a, Sample trajectory of one of hundreds of dots used to create our optic flow stimulus. Each dot appeared at a random location, travelled 4 azimuthal pixels (7.5°), and then disappeared. The dashed circle is drawn as a point of reference, and was not presented on the screen. b, c, Right–left P-EN1 bridge activity during open-loop optic flow to the left (b) and to the right (c) at 45°/s (left column) and 90°/s (right column) during trials in which the fly did not, on average, turn ( ± 10°/s) in response to the optic flow stimulus. d, e, Same as b, c but for P-EN2 neurons. f–i, Same as b–e, except that trials were included only if the fly turned with the direction of optic flow (>10°/s in the direction of optic flow). The mean and s.e.m. across trials are shown. For display, the stimulus position was nulled at time zero to highlight the movement of the stimulus. In trials in which flies turned with the direction of optic flow, the direction of visual motion experienced on their retinas was opposite to that expected from their own turning behavior, that is, the visual optic flow inputs (presented in open loop) indicated an angular velocity with the opposite sign to that indicated by proprioceptive/efference-copy inputs. That we observe a weaker asymmetry in f-i compared to b-e argues that optic flow and proprioceptive/efference-copy inputs (probably alongside vestibular inputs) are somehow combined to generate the P-EN bridge asymmetry.

