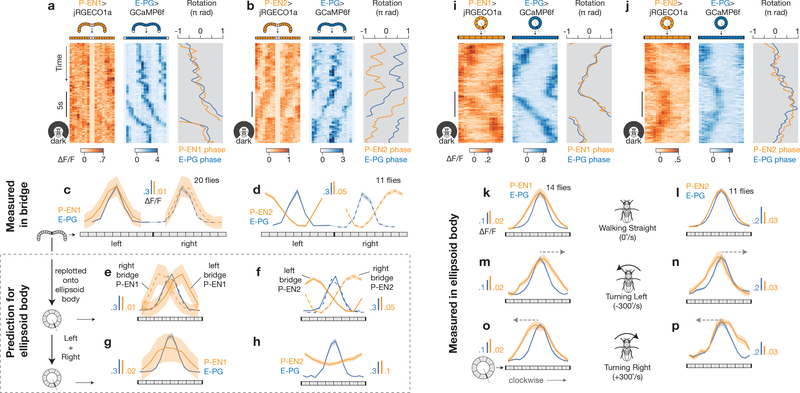
Figure 3 |. The P-EN1 activity peak leads, and the P-EN2 peak trails, a rotating E-PG peak in the ellipsoid body, as predicted by their activity in the bridge.
a, b, Co-imaging of E-PGs (GCaMP6f) with P-EN1s (jRGECOla) (a) or P-EN2s (jRGECOla) (b) in the bridge in constant darkness. c, d, Phase-nulled signals in the bridge, averaged over time. e, f, Bridge data from c, d replotted onto the ellipsoid body using each cell type’s anatomical projection pattern21. g, h, Sum of the left- and right-bridge curves in e, f (scales adjusted). i, j, Co-imaging of E-PGs with P-EN1s or P-EN2s in the ellipsoid body. k–p, Phase-nulled signals in the ellipsoid body averaged over time when the fly was walking straight (k, l), turning left (m, n) or turning right (o, p). Arrows indicate the velocity of the peaks. The P-EN ellipsoid body asymmetries were significantly different during turning and walking straight (P < 0.02), and during turning left and right (P < 0.01) (Wilcoxon rank-sum test). The mean and s.e.m. across flies are shown. c–h, k–p, Averaged over bar and dark conditions.

