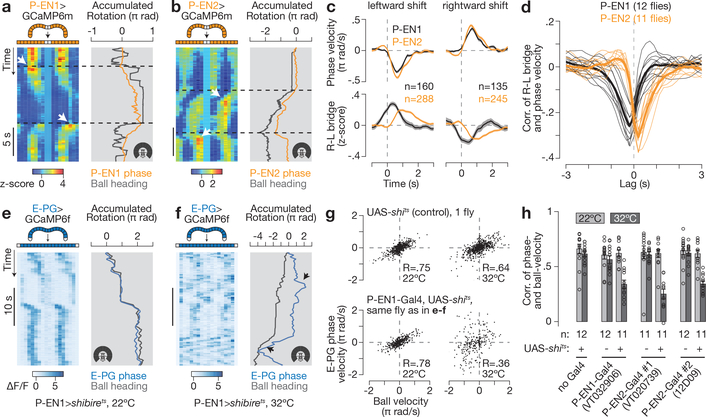
Figure 4 |. P-EN1 and P-EN2 bridge asymmetries respectively lead and lag phase shifts in time, and impairing P-ENs impairs E-PG phase updating in the dark.
a, b, Bridge activity during phase shifts in constant darkness for P-EN1 (a) and P-EN2 (b). White arrows highlight right–left asymmetries. c, Right–left bridge activity (bottom) triggered on phase changes (top). The mean and s.e.m. across phase shifts are shown. d, Correlation between right–left bridge activity and phase velocity versus time lag between the two signals. Thin lines represent single flies. Thick lines represent the mean across flies. c, d, Traces are averaged over bar and dark conditions. e, f, E-PG activity in the bridge with P-EN1 cells expressing shibirets at 22 °C (e) or 32 °C (f). Arrows highlight atypical deviations in the E-PG phase from the ball’s heading at 32 °C. g, E-PG phase velocity versus ball velocity in a control fly and a P-EN 1>shibirets fly (same as in e, f) in constant darkness. R, Pearson correlation coefficient. h, Phase vs. ball velocity correlations for three P-EN-Gal4 lines. Each circle represents one fly. The mean and s.e.m. across flies are shown. The cold-to-hot changes in correlation are significantly different between P-EN>shibirets and control groups (P < 0.01) (Wilcoxon rank-sum test). Note the different rotation scales in a, b and e, f.

