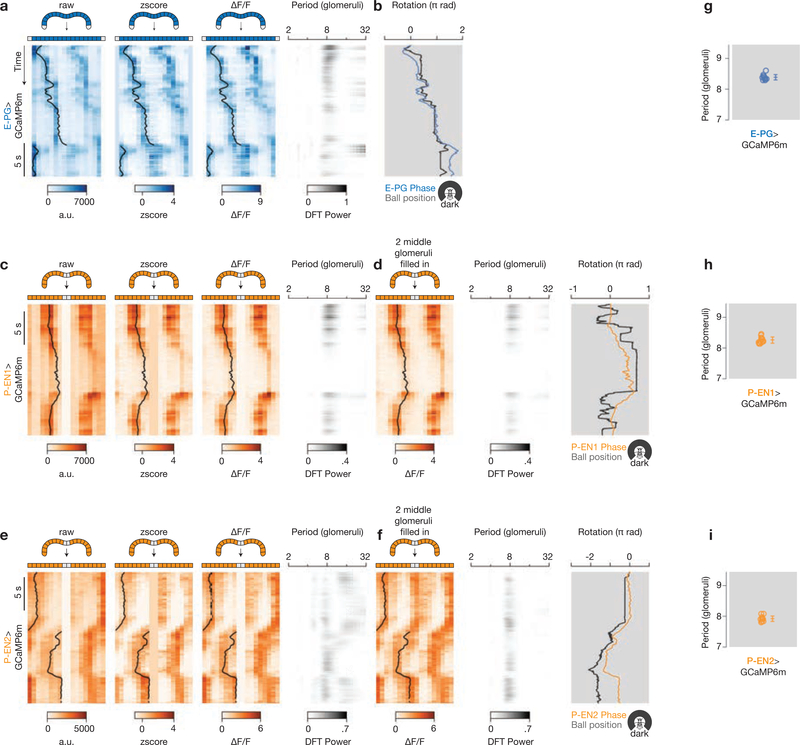
Extended Data Figure 2 |. Processing of protocerebral bridge signals from E-PG, P-EN1 and P-EN2 neurons in the dark.
a, Processing of the E-PG>GCaMP6m signal to generate the plot in Fig. 2g. Bridge signals are plotted over time as in Extended Data Fig. 1b, but in the dark.
b, Phase from the ΔF/F signal and ball position. Because the phase and ball position drift over time in the dark, we did not align the two signals by finding the best offset over the entire trial; rather, we nulled the offset between the GCaMP phase and ball heading at time zero, letting the signals drift naturally over time. For display purposes, we applied a constant gain to the ball position signal, which we determined from the slope of a linear regression between the GCaMP phase and ball velocity. c, d, P-EN1 signals (originally plotted in Fig. 4a) over time as in Extended Data Fig. 1e, f, but in the dark. e, f, Same as c, d, but for P-EN2 signals (originally plotted in Fig. 4b). The ball position gains are 0.75 for E-PG (b), 1.0 for P-EN1 (d) and 0.89 for P-EN2 (f). For P-EN1, the slope of the linear regression between phase and ball velocity was poorly estimated (see Supplementary Discussion) and thus we hand-picked the gain (1.0) in this case. That these gains are not all equal does not mean that each cell type has its own gain (see Supplementary Discussion). Note the different timescale compared to Extended Data Fig. 1.
Also note that the time window was expanded in a, b, compared to Fig. 2g, to be the same length as in c–f. g–i, Periodicity of the bridge signal at peak power in the power spectrum for each cell type. Each circle represents one fly. The mean and s.d. are shown.

