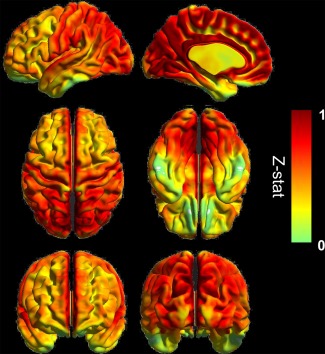
Figure 1.

Averaged VMHC map at normocapnia (N = 14), with the color bars showing the z‐statistics of the measure. Surface rendering in left lateral and mid‐sagittal (top row), dorsal and ventral (middle row), anterior and posterior (bottom row) views visualized by BrainNet Viewer (http://www.nitrc.org/bnv). [Color figure can be viewed in the online issue, which is available at http://wileyonlinelibrary.com.]
