
Figure 2.
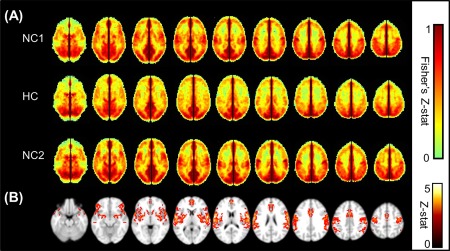
(A) Average VMHC maps showing Fisher Z‐transformed correlation, restricted to GM only, of the first normocapnic run (NC1), the hypercapnic run (HC), and the second normocapnic run (NC2). Enough time (at least 2 min) was given each time the delivered air was switched between normocapnia and hypercapnia, to allow end tidal CO2 to return to a steady state. A global decrease in VMHC is seen under hypercapnia, which is restored to the original magnitude in the final normocapnia run. The color bar shows the limits of the Z‐score values. (B) Significant group decrease from NC1 to HC shown as a result of a voxel by voxel pairwise comparison of the Fisher's Z‐transformed VMHC maps, performed in FSL/FEAT (minimum Z > 2.3; cluster level, P < 0.05, corrected). [Color figure can be viewed in the online issue, which is available at http://wileyonlinelibrary.com.]