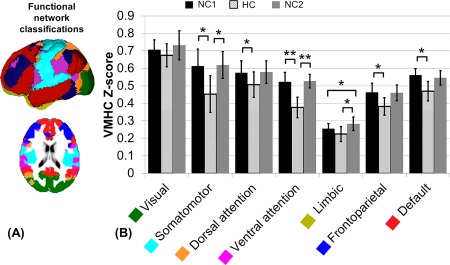
Figure 3.

(A) Functional network classification as described by Yeo et al [2011]: visual (green), somatomotor (light blue), dorsal attention (yellow), ventral attention (magenta), limbic (gold), frontoparietal (dark blue), and default (red). (B) Comparison of average VMHC Fisher Z‐transformed values during the first normocapnic (NC1), HC and second normocapnic (NC2) scans, calculated as the average of the voxel based map within each region. Error bars show standard deviation. Significance calculated based on a paired t‐test between each normocapnic and the HC scan (FDR corrected P < 0.05). There was no significant difference between the NC1 and NC2 values, except for the limbic network (P = 0.03). *P < 0.05, **P < 0.01, ***P < 0.001. [Color figure can be viewed in the online issue, which is available at http://wileyonlinelibrary.com.]
