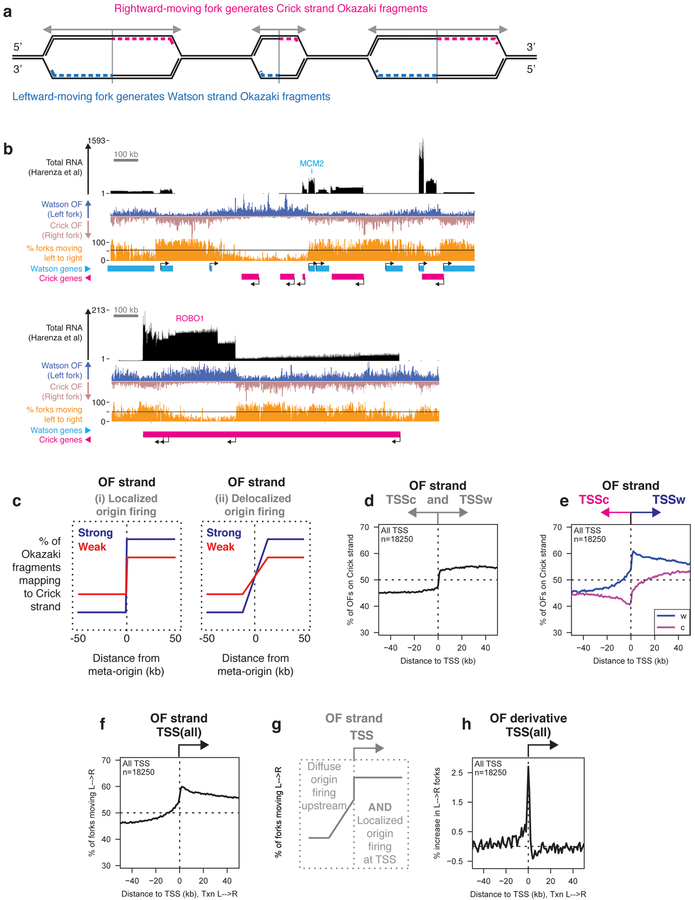
Figure 1. DNA Replication initiates preferentially at transcription start sites.
(A) The relationship between replication direction and Okazaki fragment (OF) strand.
(B) Distribution of OFs and RNA-seq reads from total cellular RNA19 in RPE-1 cells over 1.5 MB regions around the MCM2 and ROBO1 loci. Transcription start sites (TSS) are indicated, and the percentage of replication forks moving from left to right is shown in orange. Unless otherwise indicated, all data in figures 1–7 are from asynchronously dividing hTERT-immortalized RPE-1 cells, and are displayed using 1 kb bins.
(C) Schematic depiction of expected OF distributions around replication origins.
(D) Percent of RPE-1 OFs mapping to the Crick strand (indicating rightward-moving replication forks) across a ±50 kb window around annotated TSS in the human genome. All meta-analyses shown in figures 1–6 were carried out using one replicate: data from a second biological replicate are shown in the supplement.
(E) Percentage of OFs mapping to the Crick strand across a ±50 kb window around the TSS of Watson (W) or Crick (C) genes.
(F) Percentage of replication forks moving from left to right around the TSS of all genes. Here and in subsequent figure panels, data are oriented such that transcription runs from left to right (indicated by ‘Txn L→R’).
(G) Schematic representation of upstream and TSS-proximal replication initiation inferred from data in Figure 1.
(H) Replication initiation frequency, calculated as the first derivative of Okazaki fragment strand bias as a function of position, across a ±50 kb window around TSS. Data are smoothed across two 1 kb bins.

