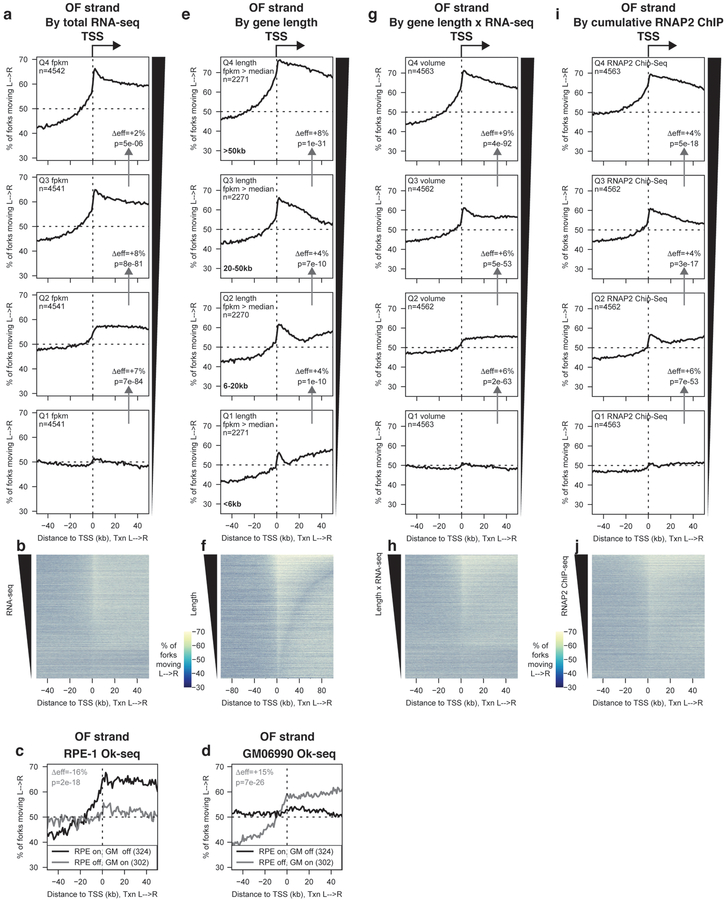
Figure 2. Total RNA polymerase occupancy of a gene predicts replication origin firing efficiency at its TSS.
(A) Percentage of replication forks moving left to right around TSS binned by total RNA-seq read depth quartile (FPKM) from19. p values were calculated using Kruskal-Wallis test, using the regions from 50–30 kb upstream and 1–10 kb downstream of the TSS. Effect sizes, shown as Δeff, were calculated using the same regions. Δeff and p values between adjacent quartiles are indicated on the relevant panels in figure 2a,e,g and h. All statistics for figures 2–6 are presented in the methods section.
(B) Heat map representation of data in (A).
(C&D) Percentage of replication forks moving left to right in (C) RPE-1 or (D) GM06990 cells7 around the TSS of genes whose transcription is off in one cell type (FPKM in first quartile) and on in the other (FPKM > median) as indicated.
(E) Percentage of replication forks moving left to right around TSS of actively transcribed genes (FPKM > median,19) binned by length according to quartiles for transcribed genes.
(F) Heat map representation of data in (E). Note that the x-axis scale differs from other panels to encompass a region ±100 kb from the TSS.
(G) Percentage of replication forks moving left to right around TSS binned by transcriptional volume (FPKM from19 × gene length).
(H) Heat map representation of data in (G).
(I) Percentage of replication forks moving left to right around TSS binned by cumulative RNAP2 ChIP-seq signal within the gene22.
(J) Heat map representation of data in (I).

