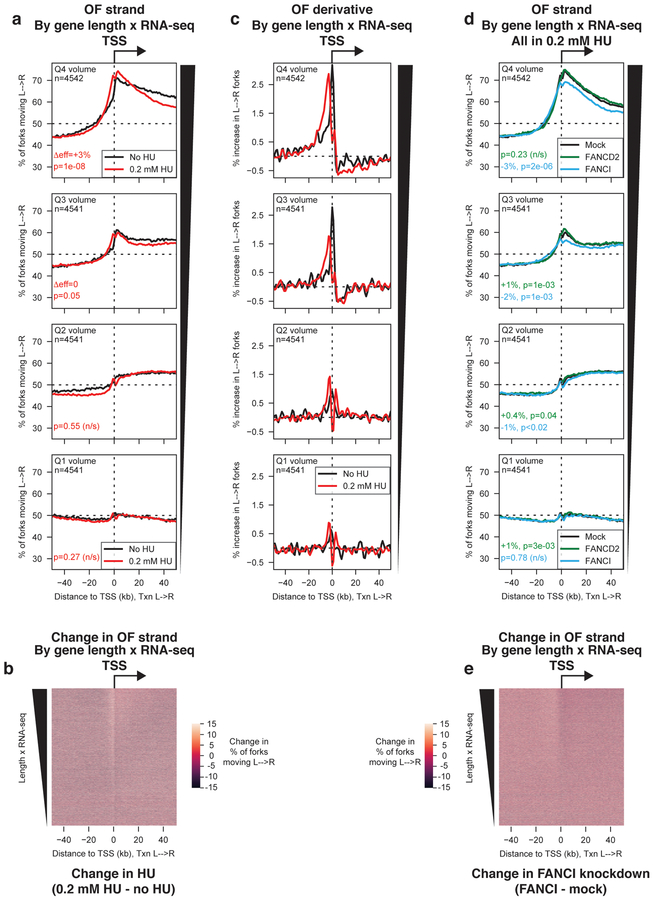
Figure 4. Global modulation of origin activity under conditions that increase or suppress dormant origin firing.
(A) Percentage of replication forks moving left to right around TSS binned by transcriptional volume, for cells grown in the absence (black) or presence (red) of 0.2 mM hydroxyurea (HU) for 4h before OF collection. p-values and effect sizes were calculated using Kruskal-Wallis relative to the no HU dataset for each quartile. Δeff and p values between the no HU and low HU sample for each transcriptional quartile are indicated in the relevant panels.
(B) Heat map representation of the change in replication direction around TSS upon treatment with 0.2 mM HU. Genes are sorted by transcriptional volume (length × FPKM). Values were calculated as %L→R0.2 mM HU - %L→ RNo HU
(C) Replication initiation frequency, calculated as the first derivative of Okazaki fragment strand bias as in Fig. 1h, around TSS in the absence or presence of 0.2 mM HU. Data are smoothed over 2 adjacent bins.
(D) Percentage of replication forks moving left to right around TSS binned by transcriptional volume, for cells treated with siRNAs against FANCD2 (green), FANCI (blue), or mock-treated (black), grown in 0.2 mM hydroxyurea for 4h before OF collection. p-values and effect sizes for both RNAi treatments were calculated using Kruskal-Wallis relative to the mock RNAi (low HU) dataset for each quartile. Δeff and p values between the low HU (mock RNAi) and either the FANCD2 (green) or FANCI (blue) knockdown sample for each transcriptional quartile are indicated in the relevant panels and in the methods section.
(E) Heat map representation of the change in replication direction around TSS in 0.2 mM HU upon FANCI knockdown. Genes are sorted by transcriptional volume (length × FPKM). Values were calculated as %L→RFANCI knockdown - %L→ RNo knockdown

