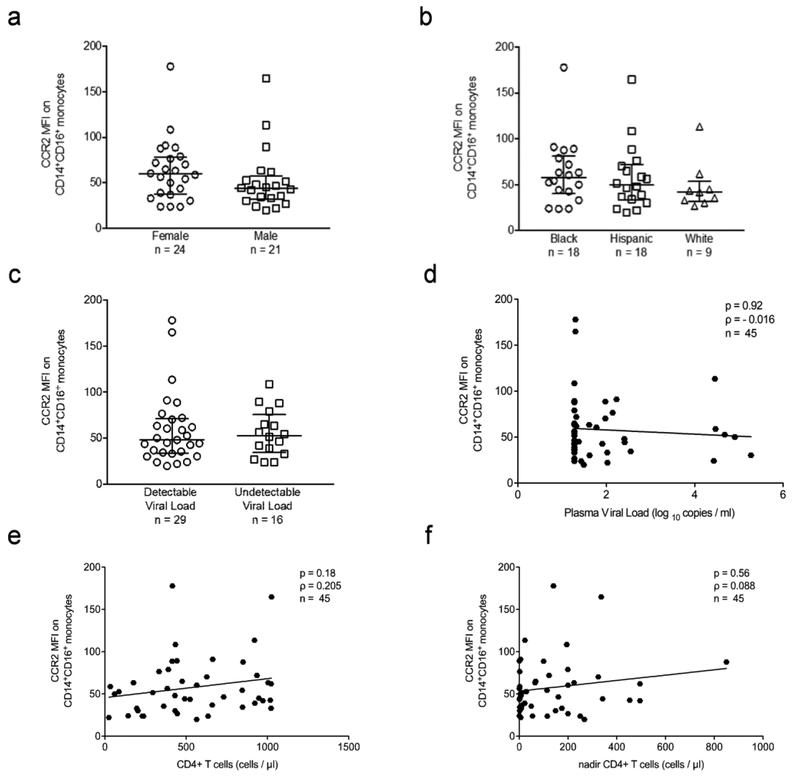
Fig. 2. CCR2 on CD14+CD16+ monocytes does not vary by demographic and HIV clinical variables.
. Surface CCR2 on CD14+CD16+ monocytes was determined by staining freshly isolated PBMC for human CD14, CD16, and CCR2, or with isotype matched control antibodies. CCR2 MFI was calculated by subtracting the MFI of the IgG2b isotype matched control staining on CD14+CD16+ monocytes from the MFI of CCR2 on CD14+CD16+ monocytes. Each data point is one individual subject. (a). CCR2 on CD14+CD16+ monocytes by sex (female: n = 24, male: n = 21). (b). CCR2 on CD14+CD16+ monocytes by ethnicity (Black: n = 18, Hispanic: n = 18, White: n = 9). (c). CCR2 on CD14+CD16+ monocytes by detection of viral load (detectable: n = 29, undetectable: n = 16). (d). Spearman’s rank correlation between CCR2 on CD14+CD16+ monocytes and viral load (log10) (n = 45, p = 0.92, ρ = −0.016). (e). Spearman’s rank correlation between CCR2 on CD14+CD16+ monocytes and current CD4+ T cell counts (cells/μl) (n = 45, p = 0.18, ρ = 0.205). (f). Spearman’s rank correlation between CCR2 on CD14+CD16+ monocytes and nadir CD4+ T cell counts (cells/μl) (n = 45, p = 0.56, ρ = 0.088). (a–c). Data are represented as median ± IQR. Significance was determined by Mann Whitney U test. Data were not significant (p > 0.05).

