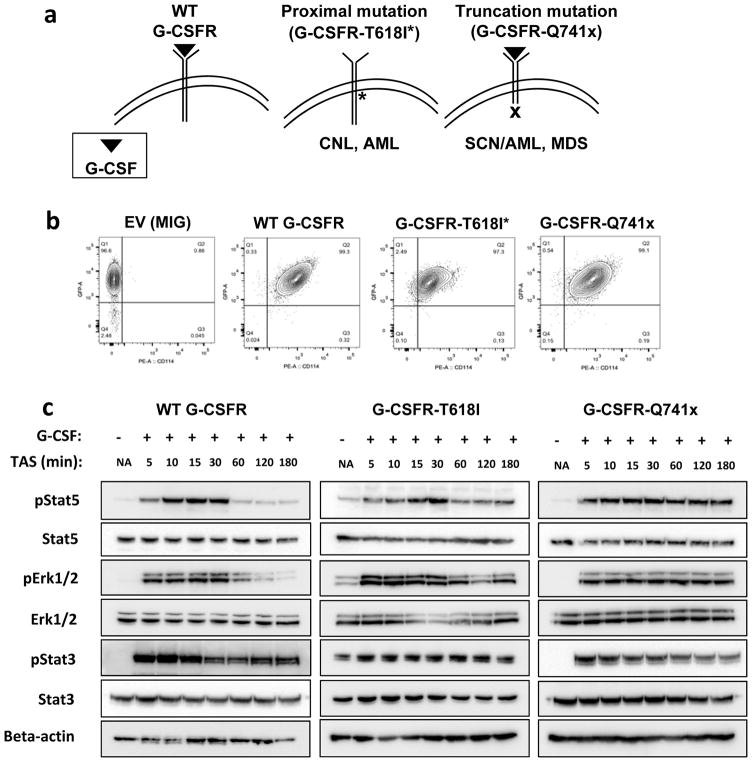
Figure 1. Generation and validation of BaF3 expressing WT and mutant G-CSFRs.
(a) Schematic of G-CSF/G-CSFR topology in the plasma membrane and sites of mutations found in the indicated disease phenotypes. (b) Flow cytometry plots of transduced BaF3 cells validating equivalent levels of G-CSFR expression after FACS-sorting (EV: empty vector, MIG: MSCVIRES-GFP). (c) Immunoblot analyses of the transduced BaF3 cells after 6 hour serum starvation and G-CSF stimulation (TAS: Time after Stimulation). The immunoblots shown here are representative of two independent experiments (n=2).

