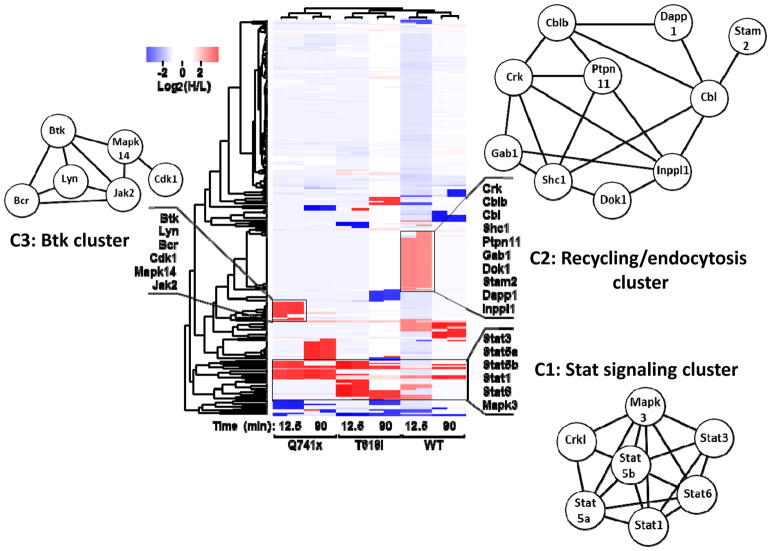
Figure 3. Effect of G-CSF induction on the normal and malignant G-CSFR phosphotyrosine proteome.
R based unsupervised hierarchical clustering heat map analyses was performed using log2 transformed heavy to light phospho-tyrosine peptide ratios (H/L). The color key denotes red as up-regulated and blue as down-regulated phospho-tyrosine sites after G-CSF induction. The clusters were further analyzed using the STRING network analysis tool. Protein network diagrams are displayed for three clusters of uniquely up-regulated or downregulated phospho-tyrosine sites (C1, C2, C3). The length of the edges between two nodes represents the association/interaction score generated by STRING, with higher scores illustrated as shorter lines.

