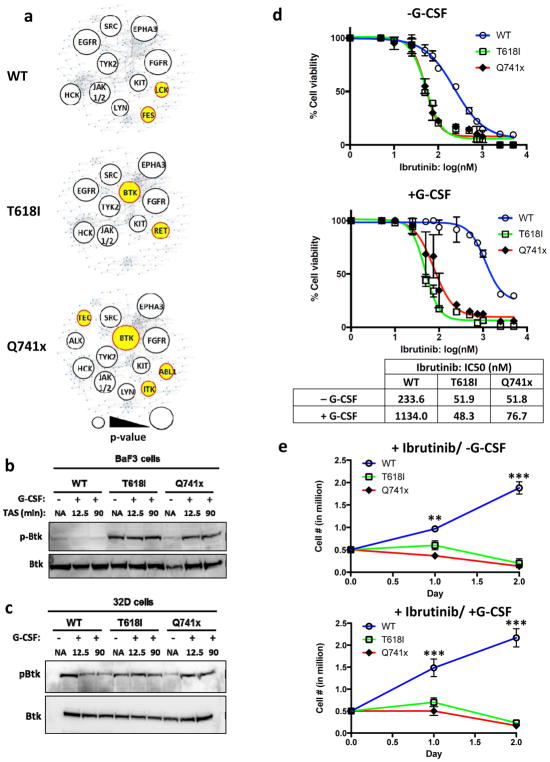
Figure 4. Aberrant Btk activation and dependence of mutant G-CSFR-expressing cell lines.
(a) Kinase Enrichment Analysis was used to identify the potential kinases behind the differential phospho-tyrosine landscape observed in the global phospho-tyrosine data. Kinases enriched are depicted as a bubble blot, with lower p-values illustrated as larger bubbles. The p-value cut-off was less than or equal to 0.05. The unique kinases identified only in the mutant or WT group are depicted in yellow. (b–c) Representative immunoblots using lysates from BaF3 or 32D cell lines after 6 hour serum starvation and G-CSF stimulation (TAS: Time after Stimulation). (d) Ibrutinib dose curves of 32D cell viability with and without G-CSF stimulation. IC50 values were calculated in Prism statistical analysis software using the three-parameter logistic method. (e) Growth curves of 32D cell lines treated with 100 nM Ibrutinib and cultured with or without G-CSF. Experiments in panels d and e were performed as three independent biological replicates (n=3) (*** = p value < 0.001, ** = p value < 0.01, student t-test).

