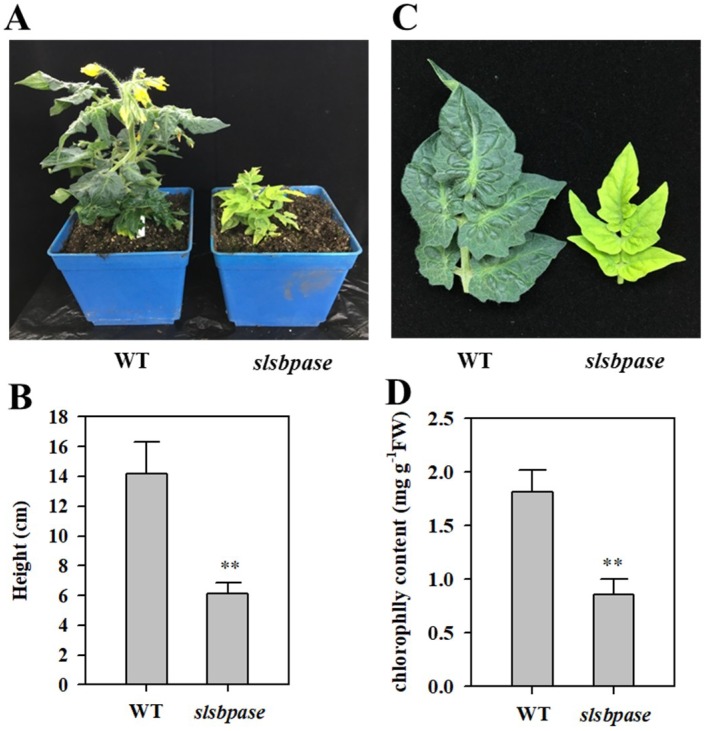
Figure 2.
Characterization of slsbpase mutant. (A) Phenotypes of slsbpase mutant plants (slsbpase) and wild-type plants (WT). (B) Plant height of wild-type and mutant plants. (C) Leaf chlorosis phenotype of slsbpase mutant. (D) Leaf chlorophyll content of wild-type and mutant plants. The values presented are means ± SDs (standard deviation, n = 3). Asterisks indicate significant difference at ** p < 0.01 between slsbpase mutant plants and wild-type plants.

