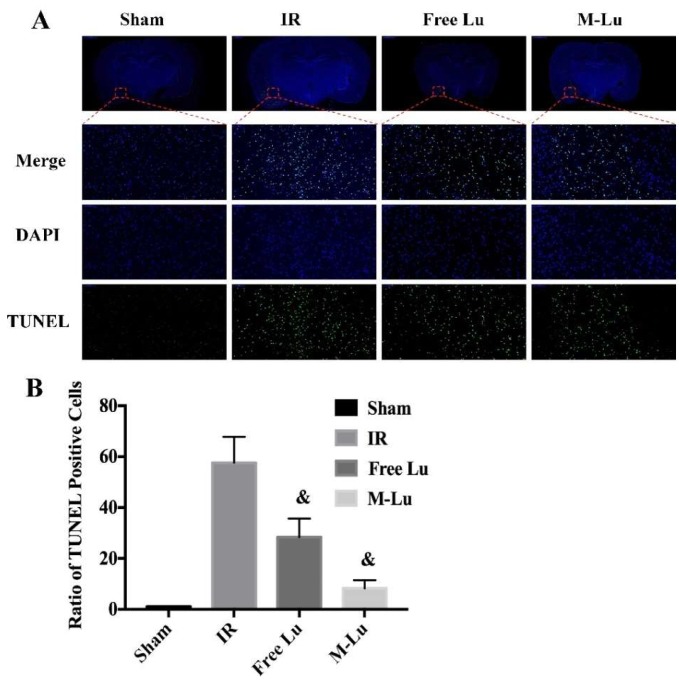
Figure 9.
(A) The TUNEL stain in each group (n = 5). The green fluorescence represented the TUNEL positive cells, and the blue fluorescence was DAPI. (Magnification of region: 200 times) (B) The quantitative analysis of the TUNEL positive cells in ischemia penumbra. Statistical difference from IR group (& denotes p < 0.05). Values were mean ± SEM.

