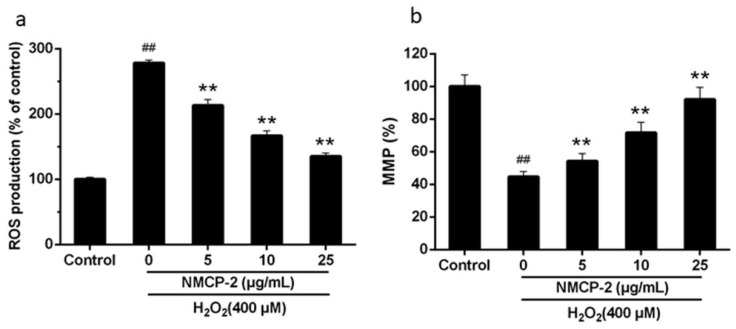
Figure 7.
Effect of NMCP-2 on H2O2-induced intracellular accumulation of reactive oxygen species (ROS) and mitochondria membrane potential (MMP). Histogram showing the (a) ROS level and (b) MMP level in HEK 293T cells after treatment with H2O2 in presence or absence of NMCP-2 (5, 25 μg/mL) compared to untreated groups. Data are presented as mean ± SD (n = 3). ## p < 0.01 differs from control group; ** p < 0.01 differs from model group.

