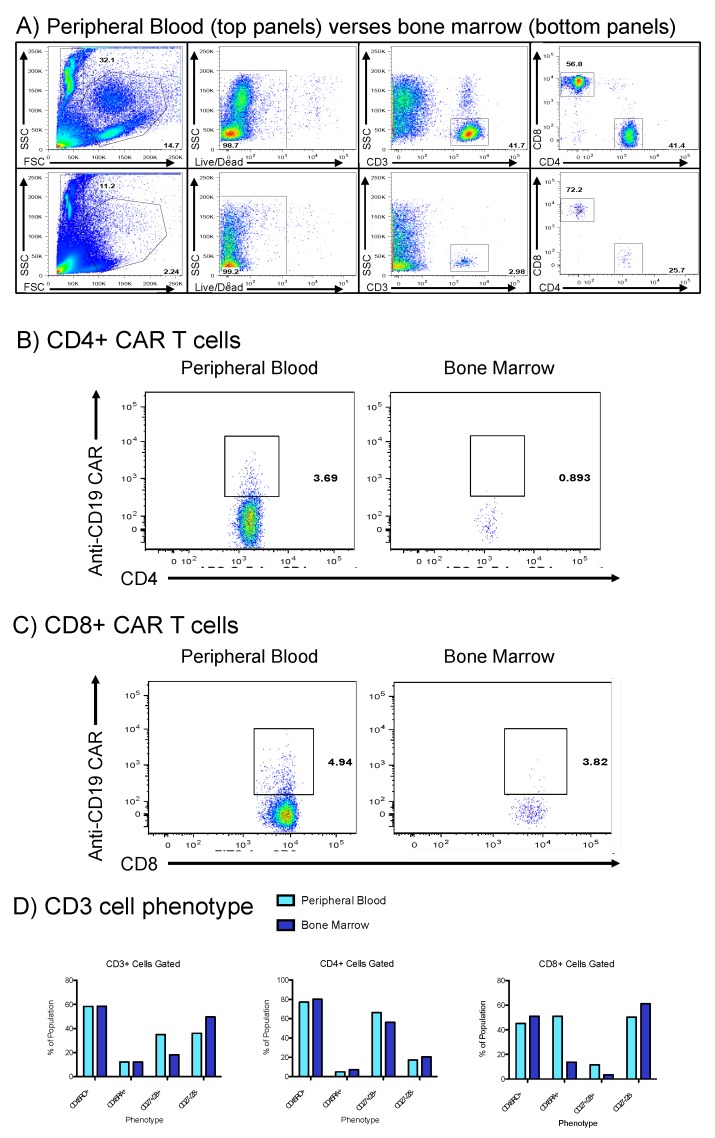
Figure 4.
Comparison of bone marrow aspirates and peripheral blood during episode of pancytopenic aplasia. (A): Whole peripheral blood (top) was compared to bone marrow aspirates (bottom row) with qualitative finding of reduced marrow cellular content. (B,C): CD4+/CD8+ CAR T cells, respectably, were detectable in the peripheral blood and to a minimal extent in the marrow. (D): Comparison of memory/activated T cell (CD45RO+), naïve T cell (CD45RA+), and CD27/28 co-expression in bone marrow (dark blue) and peripheral blood (light blue).

