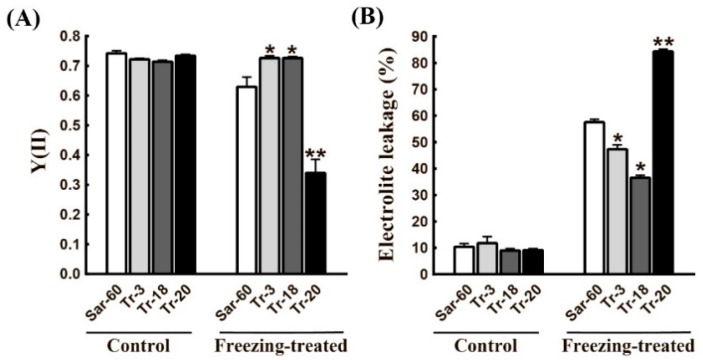
Figure 6.
Freezing tolerance test of transgenic wheat plants overexpressing AtOPR3. Freezing treatments were performed on homozygous T2 plants, as described in the Materials and Methods section, and then the degree of damage was assessed by measurements of PS II operating efficiency (A) and electrolytes leakage (B) in control and treated leaves of Sar-60, Tr-3, Tr-18, and Tr-20. Means of 20 measurements ± SE are presented. Stars indicate statistically significant differences from Sar-60 (* p ≤ 0.05, ** p ≤ 0.001).

