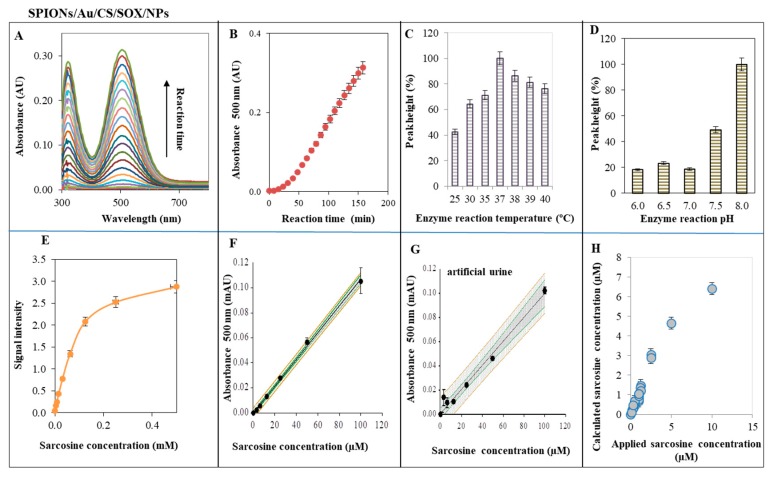
Figure 6.
Determination of SOX activity of SPIONs/Au/CS/SOX/NPs using 4-AAP. 4-AAP reaction dependence of time reaction course. (A) Typical absorbance spectra (350–800 nm), time measurements, the first time is zero and measurements were repeated after 3 min up to 60 min and can be seen how the curve rises (i.e., last green line is measurement after 60 min; the penultimate red is measurement after 57 min, and so forth); (B) 4-AAP reaction dependence of the signal at 500 nm on reaction time of the main signal; (C) 4-AAP reaction dependence on the temperature (25, 30, 35, 37, 38, 39, 40 °C) of the enzyme reaction; (D) 4-AAP reaction dependence on pH (6.0, 6.5, 7.0, 7.5, 8.0) effect of the enzyme reaction. Dependence of signal intensity: (E) on high sarcosine concentration (0–0.5 mM); and (F) low concentrations of sarcosine (0–100 μM); (G) sarcosine in artificial urine (0–100 μM); (H) correlation between the applied and calculated concentration of sarcosine (0–10 μM). Error bars were calculated from 5 independent measurements. Other details are provided in Section 4.

