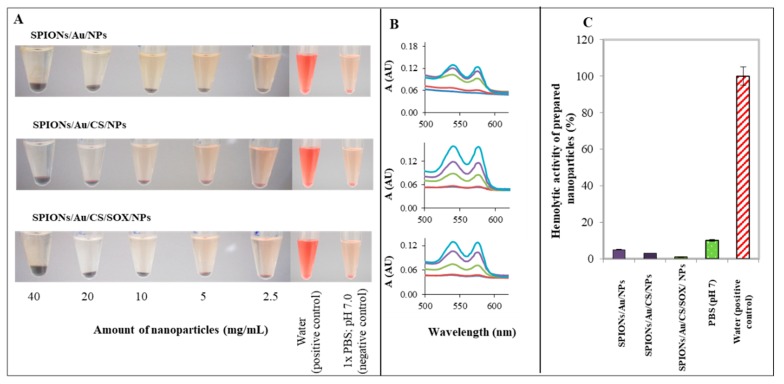
Figure 9.
Determination of hemolytic activity of prepared nanoparticles (NPs). (A) Photographs of each variant (centrifugation 2000× g, 5 min to a completely clear solution). Tested variants: water (positive control), 1× PBS, pH 7.0 (negative control), SPION/Au/NPs, SPION/Au/CS/NPs, SPION/Au/CS/SOX/NPs (40, 20, 10, 5, 2.5 mg/mL). (B) Supernatant was spectrophotometrically analyzed, the absorbance spectra were obtained and the results were evaluated at 570 nm (light blue line is a positive control, dark blue line is a negative control, and violet, green and red lines represent 40, 20, 10, 5, and 2.5 mg/mL of NPs, respectively. (C) Relative comparison of hemolytic activity of tested NPs, 100% of water is a positive control. Experiment was carried out in four replications. Blood parameters were: RBC (red blood cells) 5.16 × 10¹² L; HBG (hemoglobin) 161 g/L; MCV (mean corpuscular volume) 83.6 fL. Error bars were calculated from 5 independent measurements. For other details see Section 4.

