Figure 1.
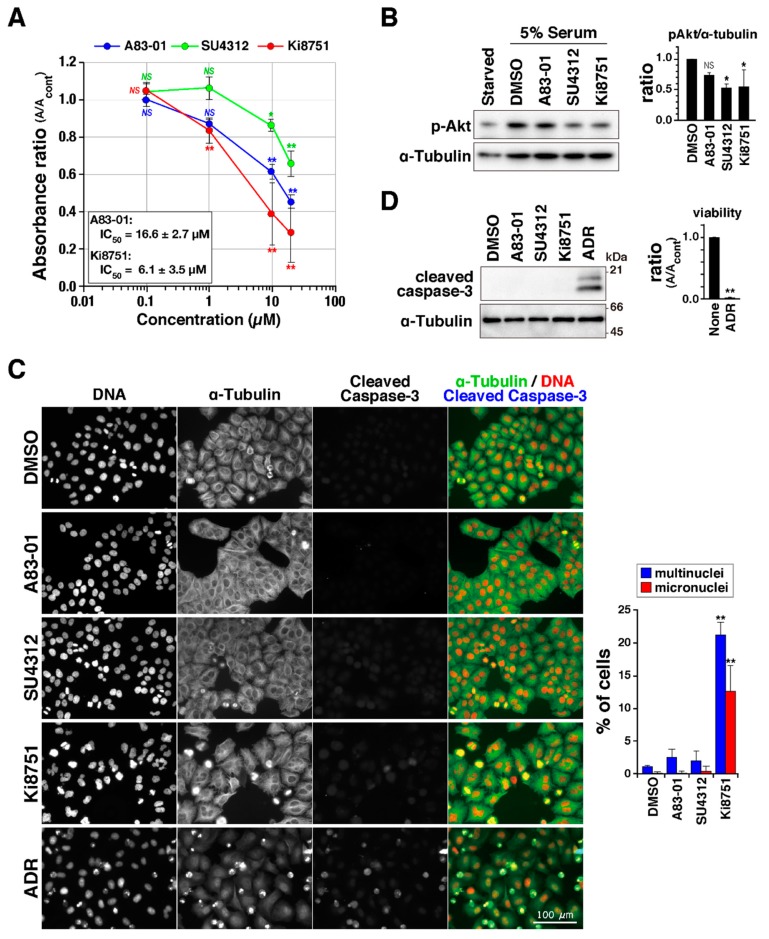
Vascular endothelial growth factor receptor (VEGFR) inhibitors suppress cell proliferation. (A) HeLa S3 cells were treated with A83-01, SU4312, and Ki8751 at the indicated concentrations for 2 days, and viable cells were determined by monitoring the absorbance of the formazan at 450 nm. Relative values are shown as a ratio of absorbance to solvent control (di-methyl sulfoxide, DMSO) using the mean ± S.D., calculated from three independent experiments. IC50 was calculated in A83-01–, Ki8751–treated cells in each experiment, and the mean ± S.D. was shown in the graph. Asterisks indicate statistical significance (* p < 0.05; ** p < 0.01; NS, not significant), calculated using Scheffe’s F test. (B) Cells were cultured without serum for 1 day and then pretreated with the indicated inhibitors or DMSO as a solvent control for 30 min. Then, serum was added into the culture, and cells were continuously treated with inhibitors for 30 min. Whole cell lysates were analyzed using Western blot analysis with anti-phospho-Akt (pSer473) and anti-α-tubulin antibodies. Phosphorylation of Akt was quantified by measuring the signal intensity of the bands. The ratios of signal intensity of phosphorylated band of Akt to that of α-tubulin are shown as the mean ± S.D., calculated from three independent experiments. Asterisk indicates statistical significance (* p < 0.05; NS, not significant), calculated using Scheffe’s F test. (C) Cells were treated with 20 µM A83-01, 20 µM SU4312, 20 µM Ki8751, and 4 µM Adriamycin (ADR) for 24 h and then fixed and stained for DNA (red), α-tubulin (green), and cleaved caspase-3 (blue). Scale bar, 100 µm. The number of cells with multinuclei or micronuclei was counted and is shown as the mean ± S.D., calculated from three independent experiments (n > 155 in each treatment). Asterisks indicate statistical significance (** p < 0.01), calculated using Scheffe’s F test. (D) (Left), cells were treated with 20 µM A83-01, 20 µM SU4312, 10 µM Ki8751 and 4 µM ADR for 24 h, and the lysate was prepared and analyzed for cleaved caspase-3. (Right), cells were treated with 4 µM ADR for 48 h, and viable cells were determined as shown in (A). Relative values are shown as a ratio using the mean ± S.D., calculated from three independent experiments. Asterisks indicate statistical significance (** p < 0.01), calculated using Student’s t-test.

