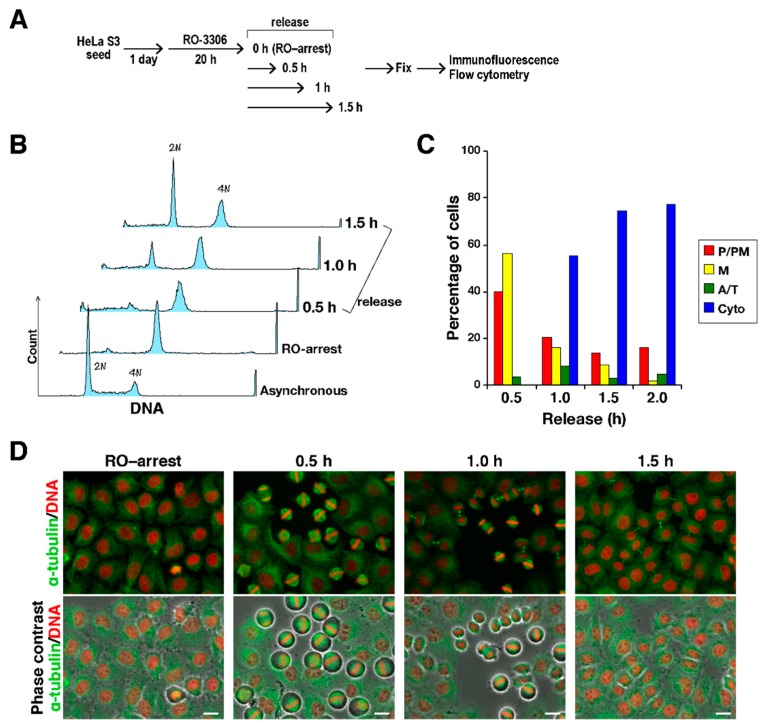
Figure 2.
Cell cycle synchronization in M phase. Cells were treated with 6 µM RO-3306 for 20 h. After release from RO-3306 treatment, the cells were fixed at 0.5, 1, and 1.5 h after the release. (A) A schematic depiction of the experiment is shown. (B) Cells were stained for DNA with propidium iodide, and DNA content was measured by a flow cytometer. Each curve represents 5000 cells. Peak haploid genome equivalents (2N, 4N) are indicated. (C) On the basis of α-tubulin and DNA morphologies under a microscope, the M phase cells were classified into four groups: prophase/prometaphase (P/PM), metaphase (M), anaphase/telophase (A/T), and cytokinesis (Cyto). The percentages of cells in each group are plotted (n > 204). (D) Representative images are shown; α-tubulin (green), DNA (red). Scale bars, 20 µm.

