Figure 3.
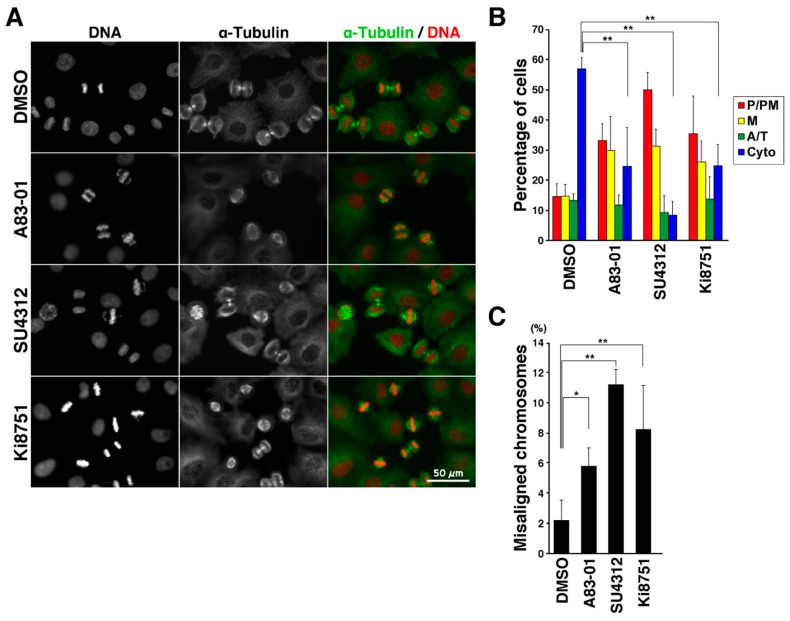
VEGFR inhibitors delay M phase progression. Cells were treated with 6 µM RO-3306 for 20 h. After release from RO-3306 treatment, the cells were incubated with inhibitors for 60 min and fixed with 4% formaldehyde. The fixed cells were then stained for α-tubulin and DNA. (A) Representative images are shown. Scale bar, 50 µm. (B) On the basis of α-tubulin and DNA morphologies under a microscope, the M phase cells were classified into four groups: prophase/prometaphase (P/PM), metaphase (M), anaphase/telophase (A/T), and cytokinesis (Cyto). The percentages of cells of each group are plotted as the mean ± S.D., calculated from three independent experiments (n > 241 in each experiment). (C) The number of cells with misaligned chromosomes was counted under a microscope. The percentages of cells exhibiting misaligned chromosomes are plotted as the mean ± S.D. of three independent experiments (n > 241 in each experiment). The Tukey–Kramer multiple comparisons test was used to calculate p values. * p < 0.05; ** p < 0.01; NS, not significant.

