Figure 4.
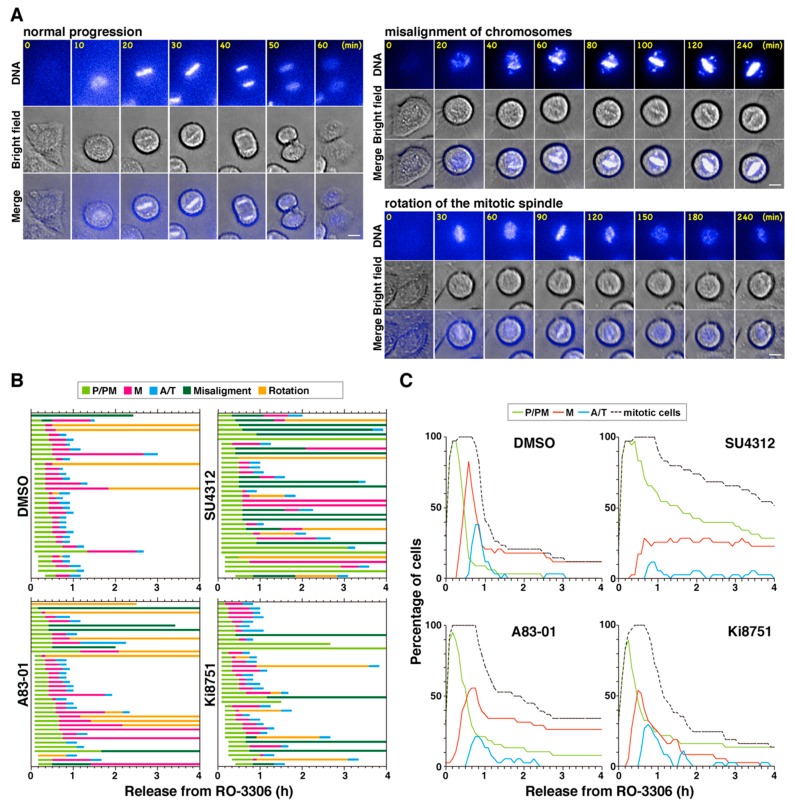
VEGFR inhibitors cause aberrant M phase progression. Cells were treated with 6 µM RO-3306 for 20 h and released in the presence of DMSO, 3 µM A83-01, 10 µM SU4312, or 1 µM Ki8751, together with 0.1 µM Hoechst 33342 to visualize DNA. Mitotic progression was monitored every 5 min for 3 h by time-lapse imaging. (A) Representative images of cells exhibiting normal M phase progression, misalignment of chromosomes, and rotation of the mitotic spindle are shown. Scale bars, 10 µm. (B) Based on the time-lapse images shown in (A), the duration of each mitotic phase (prophase and prometaphase(P/PM, light green), metaphase (M, red), anaphase and telophase (A/T, blue)), misalignment of chromosomes (deep green), and rotation of the mitotic spindle (orange) in individual cells are shown (DMSO, n = 34; A83-01, n = 38; SU4312, n = 35; Ki8751, n = 37). (C) The percentages of mitotic cells (black), cells in prophase and prometaphase (P/PM, green), metaphase (M, red), and anaphase and telophase (A/T, blue) at the indicated times are shown.

