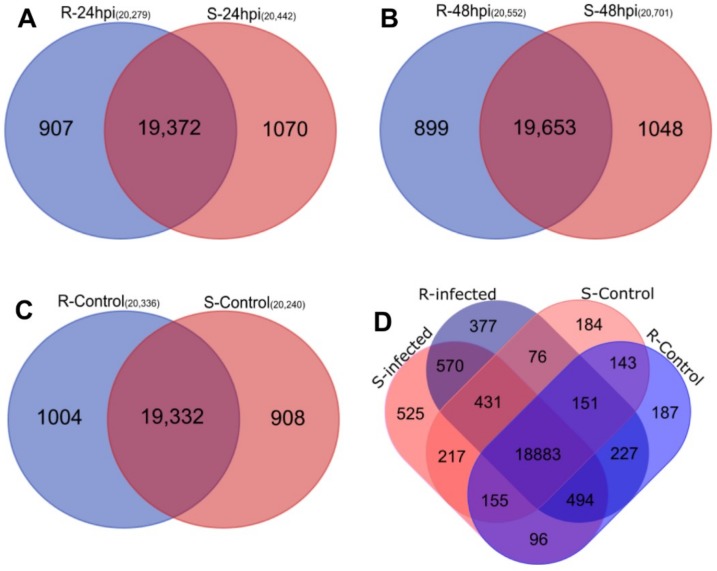
Figure 2.
Venn diagrams presenting the overlap of expressed genes between resistant (Sp-R) and susceptible (Sp-S) wild tomato accessions. Pink circle represents Sp-R and blue is for Sp-S samples. (A) Comparison of P. parasitica infected Sp-R and Sp-S samples at 24 hpi. (B) Comparison of P. parasitica infected Sp-R and Sp-S samples at 48 hpi. (C) Comparison of mock inoculated R and S samples. (D) Combined comparison between all (mock and infected) Sp-R and Sp-S libraries.

