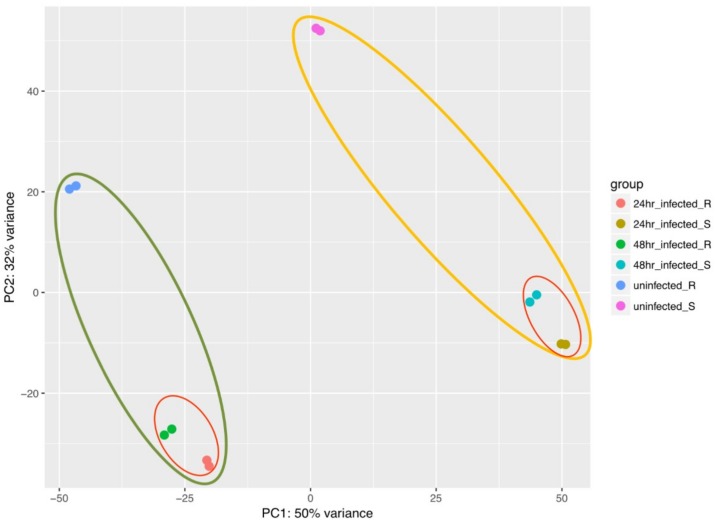
Figure 3.
Principle component analysis (PCA) plot. Sp-R and Sp-S genotype factor showed variation among all their treated mock samples. Green oval is encompassing all Sp-R samples and red oval within the green oval is showing infected Sp-R samples at each time point. Yellow oval has enclosed all Sp-S samples within that red is encircling the infected ones. Color key presenting the sample groups is given at the left. Each colored dot represents a single sample. Replications are indicated by same color dots.

