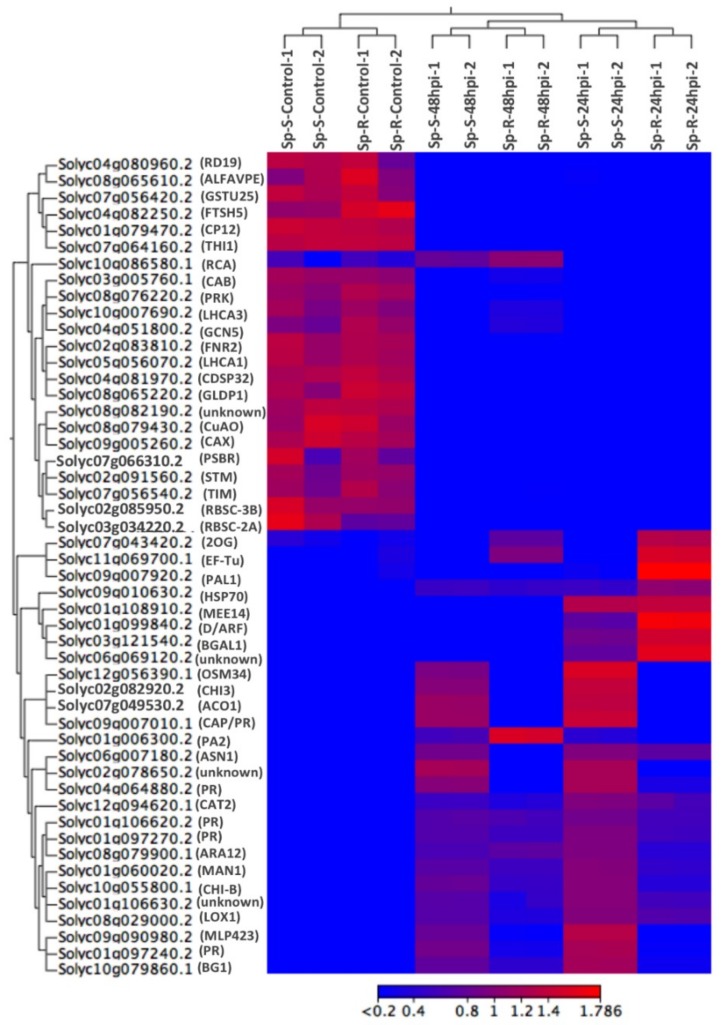
Figure 5.
Heat map showing hierarchical cluster analysis of top 50 highly expressed genes across all samples. It shows that many core plant defense genes have differential expression profiles both among treatment vs. control as well as Sp-R vs. Sp-S conditions. Gradient scale is representing expression levels with red showing highest expression to blue with lowest expression.

