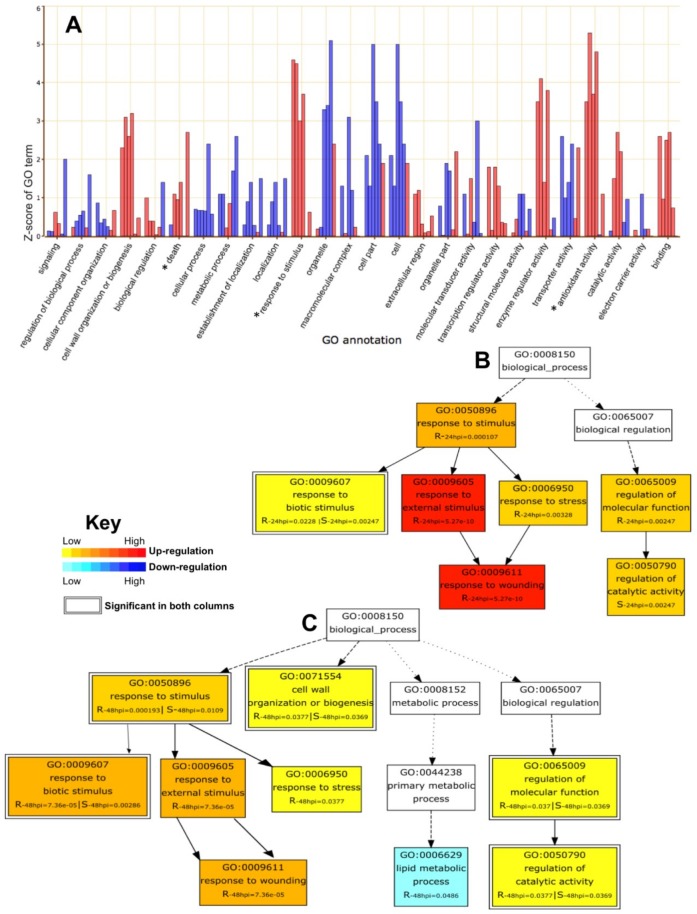
Figure 6.
Gene set enrichment analysis by parametric analysis of gene set enrichment (PAGE) tool of AgriGO. (A). Bar chart representing GO annotations across all groups. Z-scores plotted on Y axis were calculated using fold change values of DEGs. Six bars are representing six differential expression comparisons among the samples. Starting from the left, first and second bars represent Sp-R-treated vs. Sp-R-control comparison at 24 and 48 hpi respectively, third and fourth bars are depicting Sp-S-treated vs. Sp-S-control at 24 and 48 hpi respectively and fifth and sixth bars are for Sp-R-treated vs. Sp-S-treated at 24 and 48 hpi respectively. Negative Z-score depicts down regulation, represented by blue bars whereas positive Z-score means upregulation, shown as red bars. Star indicates plant defense related annotations. (B,C) Comparative (Resistant vs. susceptible) GO biological process hierarchal analysis based on gene set enrichment analysis at 24 hpi (B) and 48 hpi (C) Significantly enriched upregulated terms are shown in color gradient red to yellow, red means highest level of upregulation and yellow means slightly upregulated whereas terms in white color box are not significantly enriched.Downregulation is showed in blue color gradient. Boxes that have double borders means that gene set is significantly enriched in both R and S samples.

