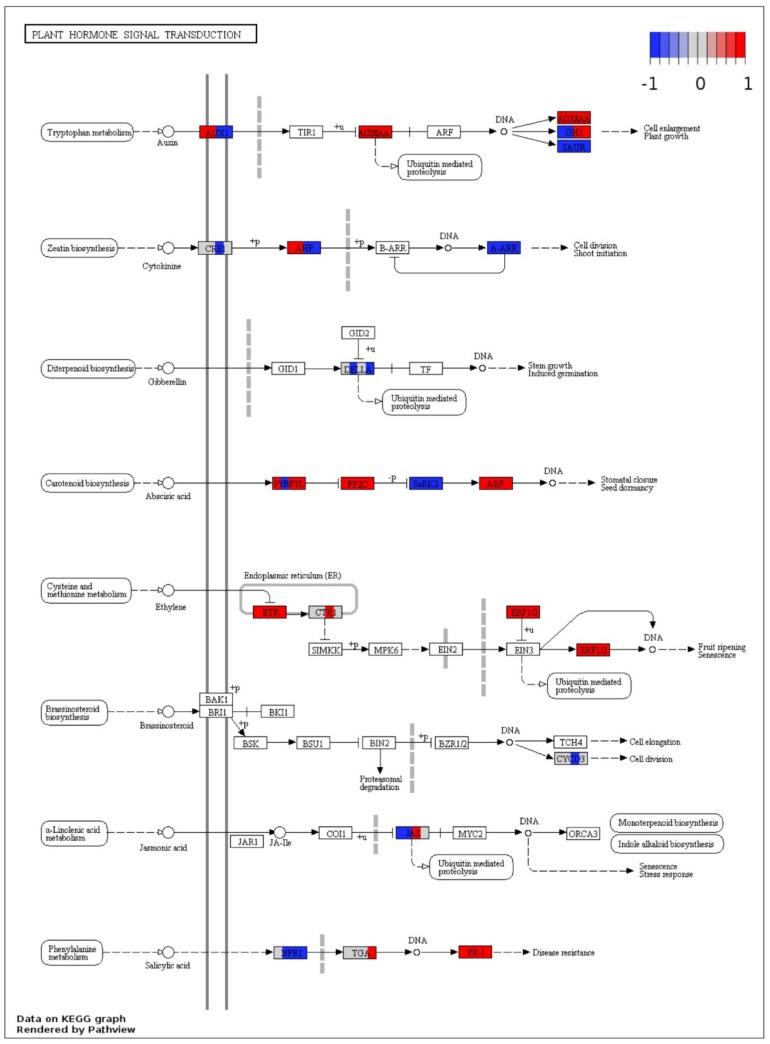
Figure 9.
DEGs mapped on plant hormone signal transduction pathway. Each box depicts DEGs from four treatments vs. control comparisons thus divided into four segments, the left half represents Sp-R treatment vs. control with first segment (left) 24 hpi and second 48 hpi. The right half depicts Sp-S treatment vs. control with first segment (left) 24 hpi and second (right) 48 hpi. White box or no color fill means no DEG was assigned to that KO term. Color gradient represents log2 fold ratios with red representing upregulation and blue representing downregulation in treatments vs. mock samples. White segment in between colors means that term was not differentially expressed in the respective comparison.

