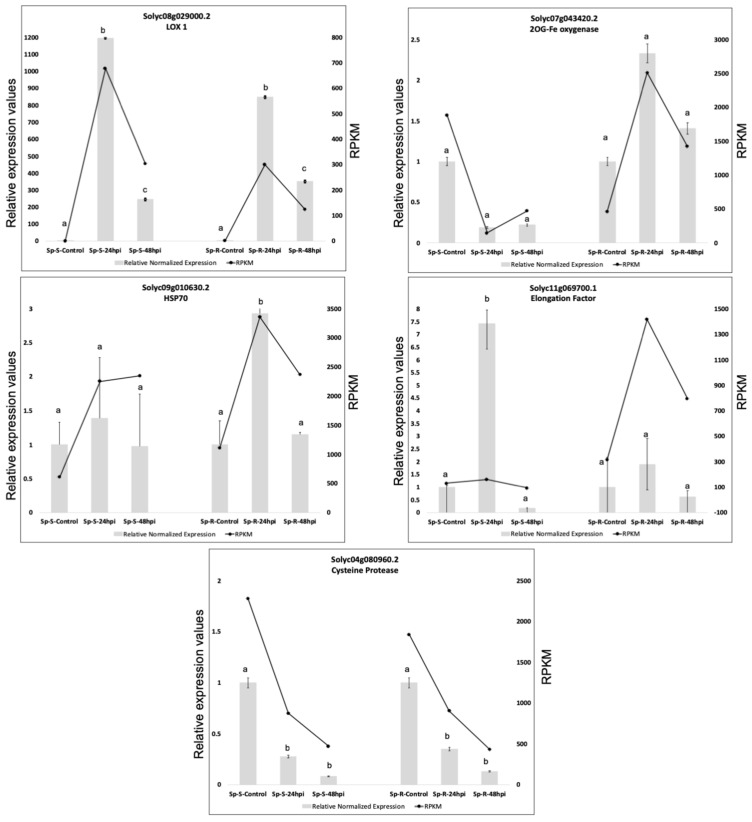
Figure 11.
qRT-PCR based validation of plant defense related DEGs of wild tomato in response to P. parasitica. Expression levels of tested genes were normalized based on transcript levels of Actin gene. RPKM values calculated from RNA-seq are compared to relative expression values determined by qRT-PCR analysis. Relative expression values of infected samples were determined by using the average expression value of all replicates of a particular group. Standard deviation among replicates is represented by error bars. Different alphabets represent significant difference at p-value < 0.05.

