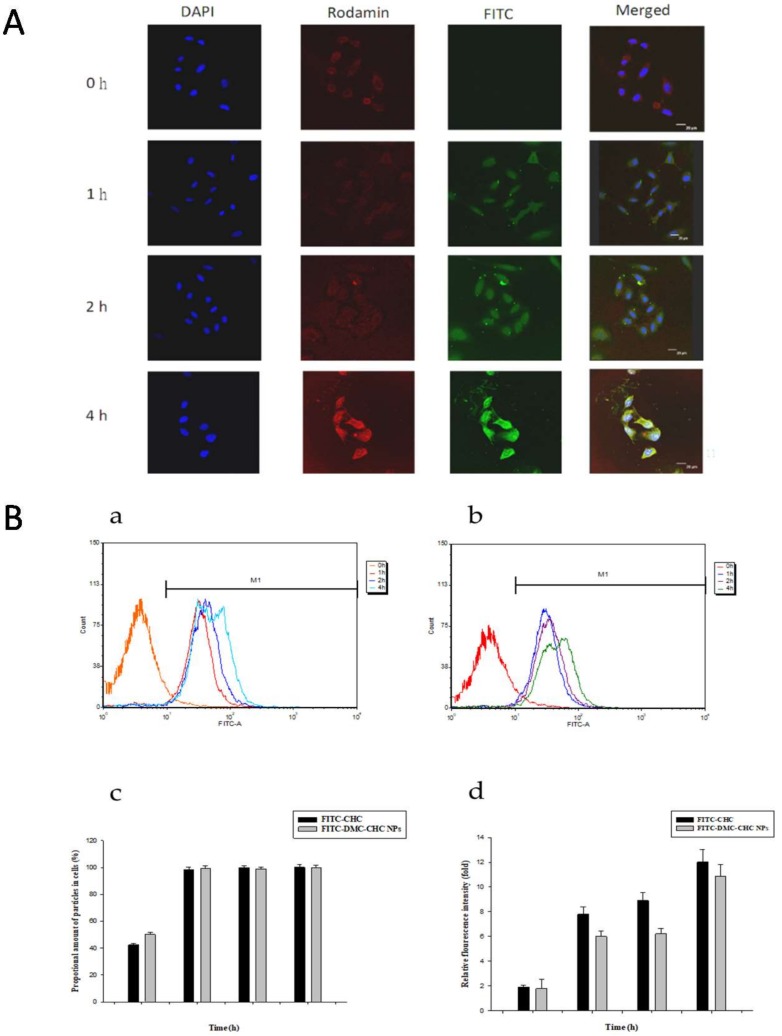
Figure 2.
(A) Fluorescence images of A549 incubated with the DMC-CHC nanoparticles (5 μg/mL) for 0–4 h. The merged image was the overlapping image obtained using the DAPI channel (blue, nuclei), rhodamine channel (red, F-actin), and FITC channel (green, nanoparticles). (B) Nanoparticles uptake efficiency measured by flow cytometer (a) 20 μg/mL FITC-CHC and (b) 5 μg/mL FITC-DMC-CHC NPs in A549. A549 were administered with or without FITC-DMC-CHC NPs for various time intervals (0–4 h). (c) To compare the proportional amount of nanoparticles, and (d) relative fluorescence intensity between FITC-CHC and FITC-DMC-CHC NPs in A549 cancer cells (M1). 10,000 cells were randomly chosen for imaging analysis with flow cytometer. Each data point is represented as the mean ± SD (n = 3). Error bars represent the standard deviation.

