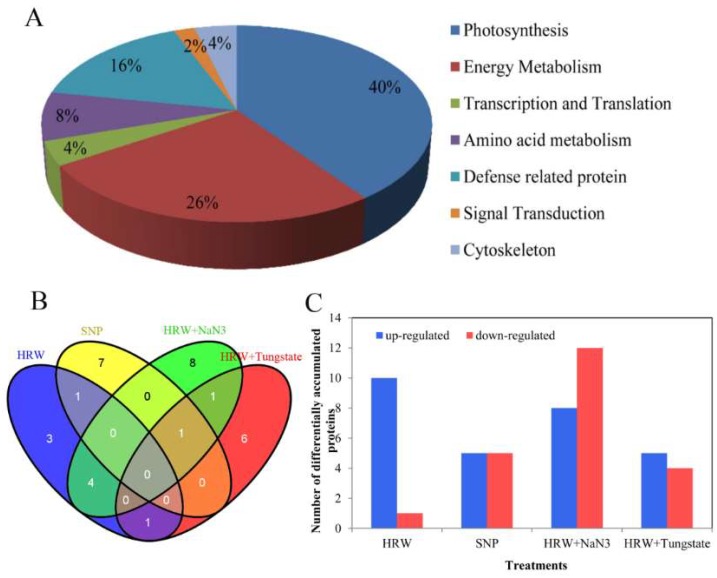
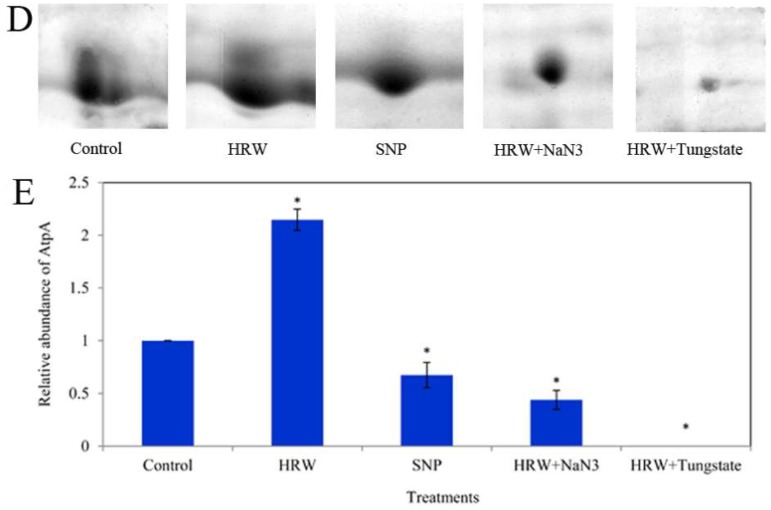
Figure 4.
Functional classification and analysis of differentially accumulated proteins in cut lilies. Pie chart showed percentage of differentially accumulated proteins in different functional categories (A); Venn diagram showed the number of overlap proteins regulated by HRW, SNP, HRW + NaN3 or tungstate compared with the control (B); Column chart showed the number of up- or down-regulated proteins in comparison with the control (C); The 2-DE gel sections showed the magnified views of differentially accumulated spots of AtpA protein in treatments. Spot positions corresponding to AtpA protein were shown with red arrows in Figure 2 (D); The column chart showed the differential relative abundance patterns among HRW, SNP, HRW + NaN3 and HRW + tungstate treatment (E).


