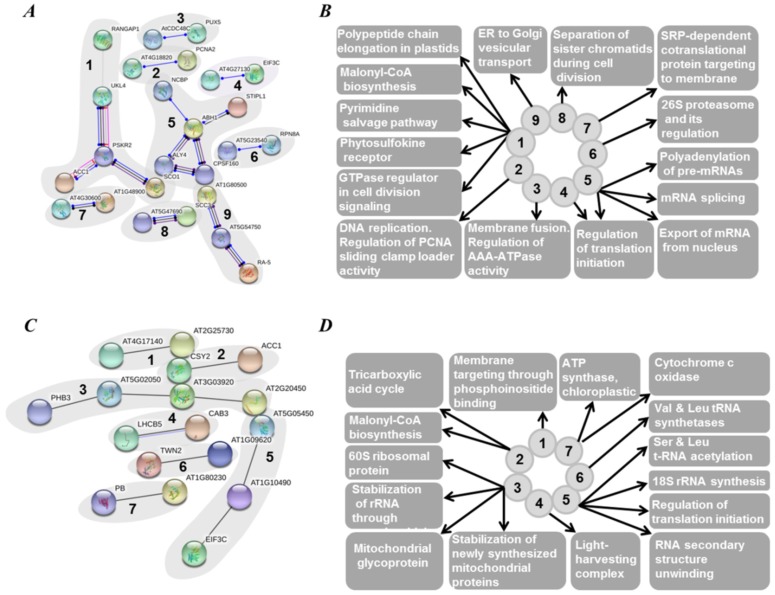
Figure 8.
String database analysis (https://string-db.org/) of interaction networks formed by proteins, unique for green seeds (cultivar Gloriosa). The networks (A,C) and related functional pathways (B,D) relied on experimentally derived functional and/or structural evidences (A,B) and coexpression data (C,D) with interaction score ≥ 0.7 (corresponded to highly confident entries). Color coding of interactions: black, reaction; blue, binding; light blue, phenotype; green, activation; purple, catalysis; red, inhibition; pink, posttranslational modifications (PTMs); yellow, transcriptional regulation. Filled and empty nodes denote proteins with known and unknown structure, respectively. Detailed description of protein data is provided in Supplementary information 7.

