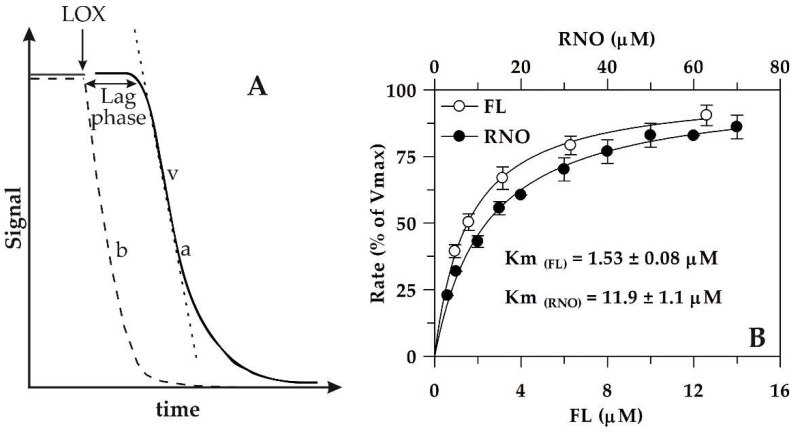
Figure 1.
Kinetics of RNO bleaching and FL quenching catalyzed by soybean LOX-1. (A) Typical experimental traces are reported relative to: (i) spectrophotometric (or fluorimetric) measurement of the LOX-1-dependent RNO bleaching (or FL quenching) reaction (trace a) and (ii) simultaneous polarographic measurement of LOX-1-catalyzed oxygen uptake (dotted line, trace b). The reaction rate (v) and the lag phase are also indicated. (B) The rates of RNO bleaching and FL quenching, expressed as (%) of Vmax, are reported as Michaelis-Menten plots. The values of 100% Vmax correspond to 0.27 ± 0.10 ΔA440∙min−1 and 0.28 ± 0.01 ΔA485∙min−1 for LOX/RNO and LOX–FL reactions, respectively. Km values are also reported. Data are recalculated from those reported in Pastore et al. [25] and Soccio et al. [26] and expressed as mean value ± standard deviation (n = 3).

