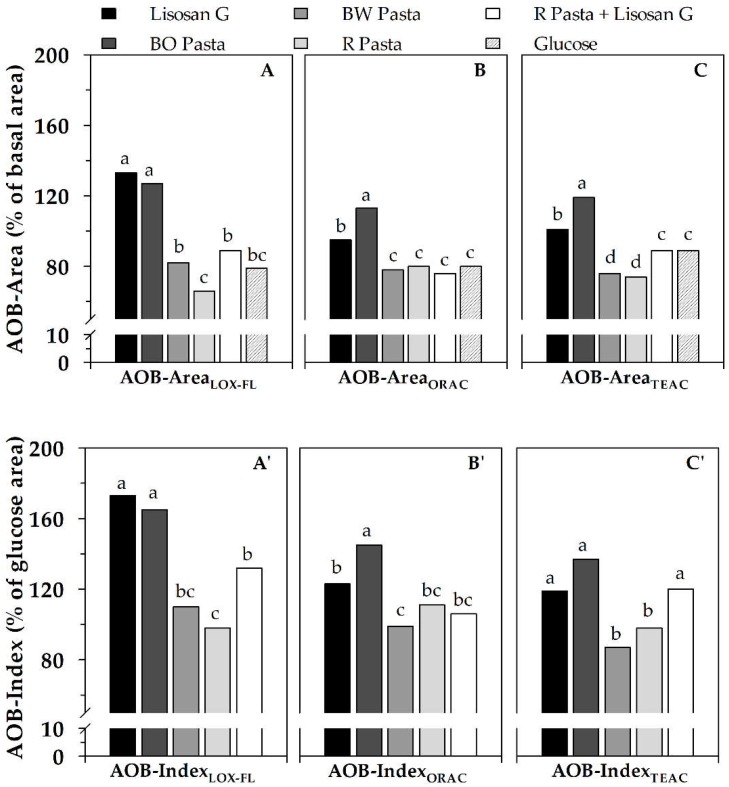
Figure 5.
AOB-Area ((A), (B), (C)) and AOB-Index ((A’), (B’), (C’)) of serum, evaluated as ACLOX–FL/PxL (AOBLOX–FL), ACORAC/PxL (AOBORAC) and ACTEAC/PxL (AOBTEAC) ratios, after consumption of different foods in seven subjects. Serving sizes were 70 g for pastas, 20 g (fresh weight) for Lisosan G and 50 g for glucose. AOB-Area and AOB-Index values of each tested food represent areas under AOB profile vs time (from 0 to 240 min), expressed as (%) of basal area and (%) of area relative to glucose consumption, respectively (see Figure 4). Data are reported as mean value (n = 7 subjects). Within the same graph, different letters indicate significant differences at p-value equal to 0.05, according to the Duncan’s test. BO pasta: pasta supplemented with bran oleoresin; R pasta: reference pasta; BW pasta: pasta supplemented with bran water extract. Data are properly re-elaborated from that reported in Laus et al. [34].

