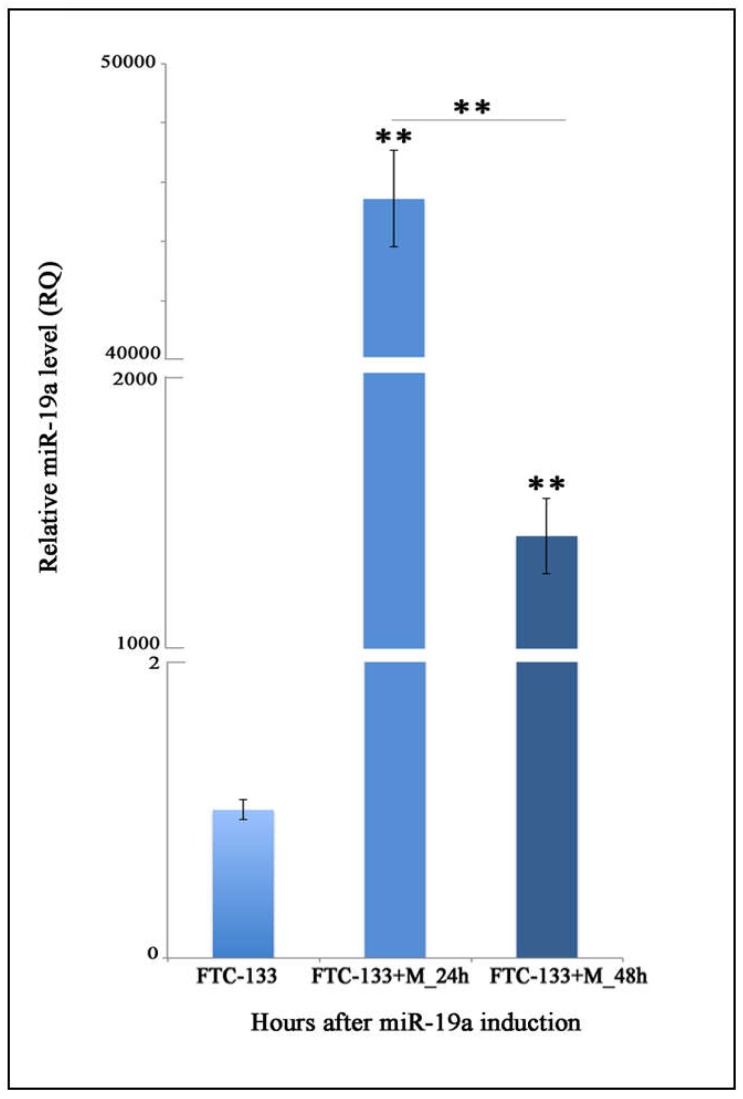
Figure 2.
MiR-19a expression levels after miR-mimic overexpression. Relative quantitation (RQ) of miR-19a expression levels time course, using FTC-133 control cells as control group. U6 has been used as endogenous control. ANOVA test p value (p < 0.0001) is reported and ** (p < 0.01) indicates significant differences both between transfected groups and control cultures and transfected groups as reported by the post-hoc test. FTC-133+M: Cells transfected with the miR mimic.

