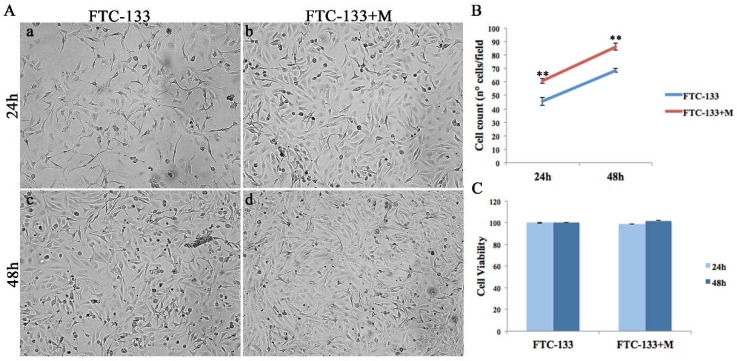
Figure 3.
MiR-19a mimic overexpression effects on FTC-133 morphology, proliferation and cell viability. (A) Morphological analysis of control (a,c) and miR-19a mimic overexpressing (b,d) FTC-133 cells, at 24 and 48 h post-transfection. (B) Cell count of control cells (blue) and miR-19a mimic overexpressing cells (red), 24 and 48 h after overexpression. Student t-test p value (p < 0.0001) indicates significant differences between miR-19a mimic transfected groups and control samples. (C) MTT assay assessed on FTC-133 and FTC-133+M, 24 and 48 h post-transfection.

