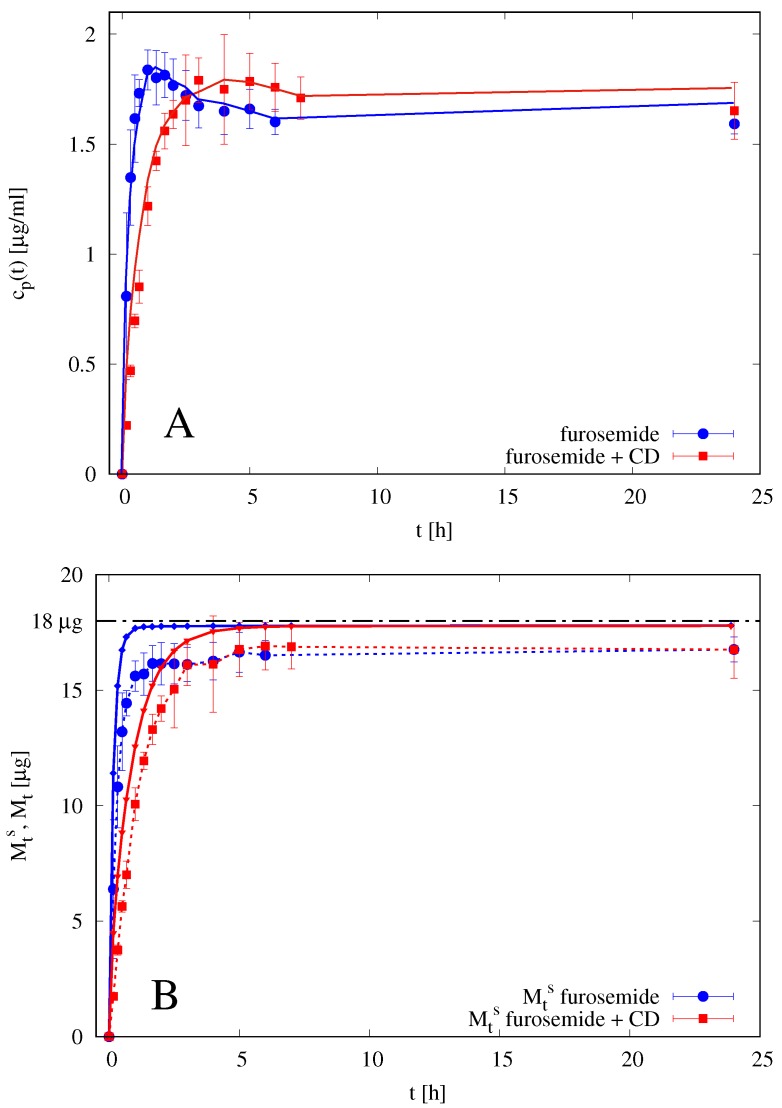
Figure 8.
Differential (A) and integral release curves (B) for blank solution of furosemide with and without HP--CD. Continuous lines represent the imperfect mixing Model III predictions with mm, m, m/s, , m/s and . (A) Differential release curves . (B) Integral release curves. dashed curves with points represent the integral release curves as evaluated from experimental data and Equation (20) by assuming a perfectly mixed accepting compartment mL. Continuous lines represent the integral release curves as evaluated from the imperfect mixing Model III. Horizontal dot-dashed line represent the amount of drug initially loaded in the donor compartment.

