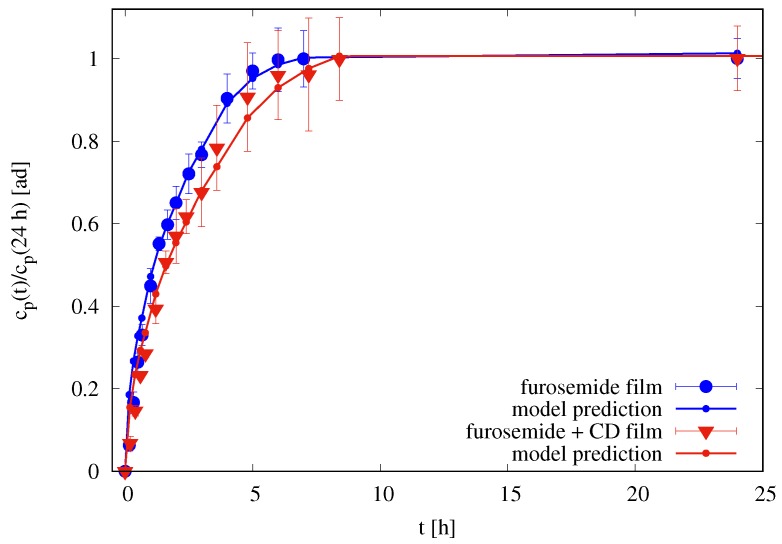
Figure 9.
Rescaled differential release curves (24 h) vs. t [h] for films in the Franz cell. Continuous lines (with small dots) represent imperfect mixing model III predictions with m, m for films without HP--CD, and m for films with HP--CD. Diffusivity values , , , and are reported in Table 2.

