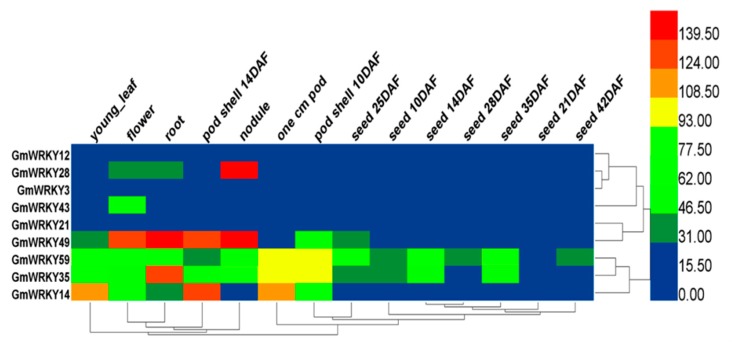
Figure 2.
Expression pattern of nine GmWRKYs in six different tissues (young leaf, flower, pod shell, seed, root and nodule). The nine GmWRKYs were selected from salt treatment RNA-Seq data based on the rule that log2 (NaCl_treat/CK2_treat) >1. The tissue expression is from SoyDB (http://soykb.org/). The color legend refers to the different expression level under normal condition. “DAF” in the tissue label indicates days after flowering.

