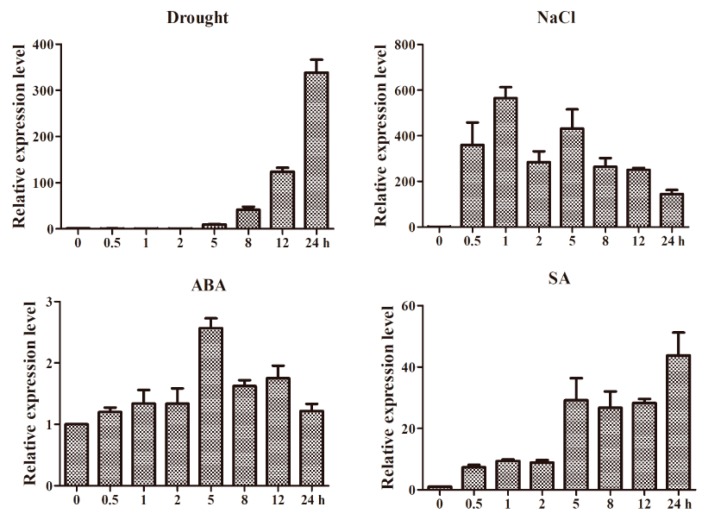
Figure 5.
Expression patterns of GmWRKY12 under drought, NaCl, exogenous ABA and SA. The ordinates are the relative expression level (fold) of GmWRKY12 compared to non-stressed control. The horizontal ordinate is treatment time for 0, 0.5, 1, 2, 5, 8, 12 and 24 h. The expression level of GmActin as a loading control. All experiments were repeated three times. Error bars represent standard deviations (SDs). All data represent the means ± SDs of three independent biological replicates.

