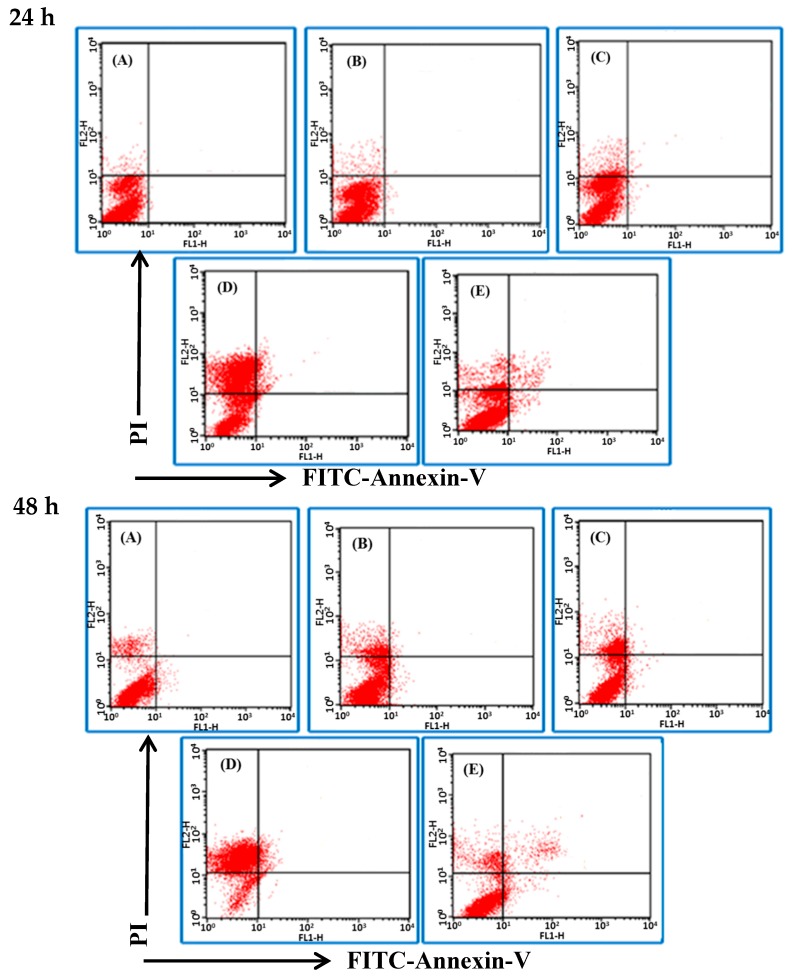
Figure 3.
Effects of BSE on H661 cell death pattern under the treatment of different durations (24 and 48 h) and different concentrations of BSE: (A) 0 μg/mL (Control), (B) 22 μg/mL, (C) 44 μg/mL, (D) 88 μg/mL, (E) Cisplatin in 100 μg/mL. Lower left (LL) quadrant: viable cells; upper left (UL) quadrant: necrotic cells; lower right (LR) quadrant: early apoptotic cells; upper right (UR) quadrant: late apoptotic cells.

