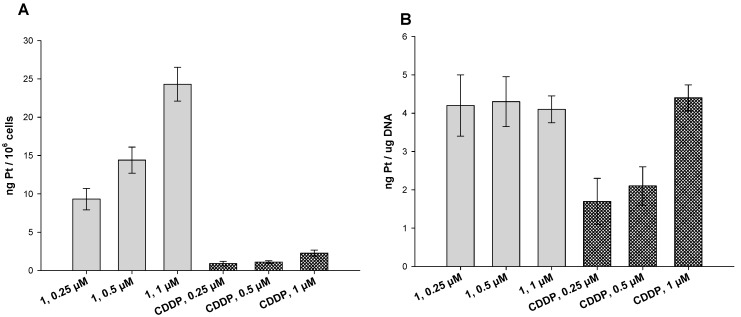
Figure 3.
Cellular uptake (A) and DNA platination (B). (A) HCT-15 cells were incubated for 24 h with increasing concentrations of 1 or CDDP. The error bars indicate SD. (B) Platination levels of nuclear DNA extracts. HCT-15 cells were treated for 24 h with increasing concentrations of 1 or CDDP. DNA was extracted, quantified, and the amount of Pt bound to DNA was estimated using GF–AAS. Error bars indicate SD.

