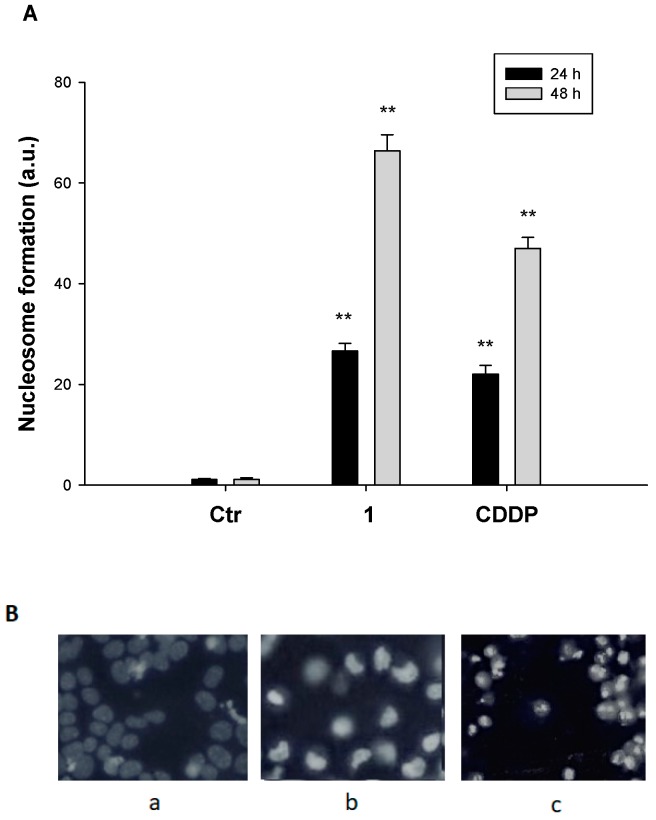
Figure 4.
DNA fragmentation and apoptosis induction. (A) Nuclear DNA fragmentation. HCT-15 cells were treated for 24 or 48 h with IC50 of 1 or CDDP. Quantitative estimation of DNA fragmentation was obtained with an ELISA test. Error bars indicate SD. ** p < 0.01. (B) HCT-15 cells were treated with IC50 of 1 or CDDP for 48 h and stained with the fluorescent dye Hoechst 33258. (a) control cells; (b) CDDP-treated cells; (c) 1-treated cells.

